Quantcast
Channel: GCN – GPUOpen
Viewing all 32 articles
Browse latest View live

AMD Crossfire API

$
0
0

Gaming at optimal performance and quality at high screen resolutions can sometimes be a demanding task for a single GPU. 4K monitors are becoming mainstream and gamers wishing to benefit from the quality provided by 8 million pixels at comfortable frame rates may need a second GPU in their system to maximize their playing experience. To ensure that performance scales with multiple GPUs some work is usually required at the game implementation level.

Alternate Frame Rendering (AFR) is the method used to take advantage of Multiple GPUs in DirectX® 11 and OpenGL® applications. The Crossfire guide describes AFR and how it is implemented in AMD drivers. The guide also provides recommendations on how to optimize a game engine to fully exploit AFR. As described in the guide the goal is to avoid inter-frame dependencies and resource transfers between GPUs. Transfers are initiated by the driver whenever it determines that a GPU has a stale resource. Transfers go through the PCI Express® bus and this is usually an expensive operation.

The Crossfire guide describes the limitations of the default AFR implementation. In summary:

  • The driver does not know what resources need tracking. It therefore tracks all of them by default.
  • The driver does not have knowledge of what region in a resource is updated. If a resource is stale all of it will be transferred.
  • The driver has to start the transfer at the end of the frame even if the resource is only used at the beginning of the frame.
  • The driver uses heuristics to detect if a resource is stale. The heuristics can fail resulting in rendering artifacts.

The solution to all above limitations is to give developers control over what gets transferred between GPUs, when to start a transfer and how to wait for the transfer to finish.

Radeon® Software Crimson Edition introduces the Crossfire API as an extension to DirectX 11. The API has:

  • Functions to enable or disable a transfer for a resource.
  • Functions to select a transfer mode for a resource.
  • Functions to select when to start a transfer.
  • Synchronization functions to avoid data hazard.

Selecting a transfer mode is done at resource creation time. For this purpose, the Crossfire API provides resource creation functions that are very similar to DirectX 11 functions with the addition of a transfer mode flag. For instance, buffers can be created with the function:


AGSReturnCode agsDriverExtensions_CreateBuffer(
    AGSContext* context,
    const D3D11_BUFFER_DESC* desc, 
    const D3D11_SUBRESOURCE_DATA* data, 
    ID3D11Buffer** buffer, 
    AGSAfrTransferType transfer_mode);

Similar functions exist to create textures. These functions are detailed in the Crossfire guide.

As you can see the function is very similar to DirectX 11 function CreateBuffer except that it takes the extra parameter transfer_mode . This parameter is an enumeration that defines how to transfer the resource. The available modes are

  • AGS_AFR_TRANSFER_DISABLE : turn off driver tracking and transfers.
  • AGS_AFR_TRANSFER_DEFAULT : use default driver tracking as if the API is not used.
  • AGS_AFR_TRANSFER_1STEP_P2P : peer to peer application controlled transfer.
  • AGS_AFR_TRANSFER_2STEP_NO_BROADCAST : application controlled transfer using intermediate system memory.
  • AGS_AFR_TRANSFER_2STEP_WITH_BROADCAST : application controlled broadcast transfer using intermediate system memory.

For the modes where the application controls the transfer three functions are provided to start a transfer and wait for the transfer to finish. The functions are:


AGSReturnCode agsDriverExtensions_NotifyResourceBeginAllAccess(
    AGSContext* context, 
    ID3D11Resource* resource);

AGSReturnCode agsDriverExtensions_NotifyResourceEndWrites(
    AGSContext* context, 
    ID3D11Resource* resource, 
    const D3D11_RECT* transfer_regions, 
    const unsigned int* subresource_array, 
    unsigned int num_subresource);

AGSReturnCode agsDriverExtensions_NotifyResourceEndAllAccess(
    AGSContext* context, 
    ID3D11Resource* resource);

NotifyResourceBeginAllAccess notifies the driver that the application begins accessing the resource. The driver waits if the resource is being used as the destination of a transfer.

NotifyResourceEndWrites is used to start transferring the resource to another GPU or GPUs. The driver will start the transfer as soon as the destination resource in the other GPU is not being accessed.

NotifyResourceEndAllAccess notifies the driver that the application is done using the resource in the frame. The driver can use the resource as the destination of a transfer.

A simple example

To demonstrate the API and how to use it efficiently let us look at a simple example where a frame depends on results computed in previous frames. Imagine we want to approximate motion blur by averaging the last rendered N frames. The pseudo code of such method is:


render_target_texture_array frame_list{N};
render_target average;
render_target back_buffer;

void render()
{
    static int frame_count = 0;
    int subresource_id = frame_count % N;
    ++frame_count;

    // render frame
    set_render_target(frame_list.sub_resource(subresource_id));
    render_scene();

    // compute average
    set_render_target(average);
    compute_average(frame_list);

    // remaining rendering
    set_render_target(back_buffer);
    finalize_rendering();
}

frame_list is a texture array that holds the N frames that will be averaged. Each frame is stored in one layer of the texture. average is the texture that stores the result of averaging all frame_list layers.

When a layer in frame_list is updated it has to be transferred to all other GPUs so that all of them have an up to date copy of frame_list . Inter-frame dependencies do not exist for average so transfers can be safely disabled.

The default AFR-Compatible driver behavior fails to detect that frame_list is stale. This is because one of the two heuristics that the driver relies on states: “A resource that is updated before it gets used within a frame is not stale”. One layer of frame_list is first rendered then the resource is used in the average computation and that is why the driver considers the resource as up to date. Details on the driver heuristics and failure cases are described in the Crossfire guide.

We will now use the Crossfire API to transfer the layer in frame_list that gets updated. Using the API the pseudo code becomes:


render_target_texture_array frame_list{N}; // created with AFR_TRANSFER_2STEP_WITH_BROADCAST
render_target average; // created with AGS_AFR_TRANSFER_DISABLE
render_target back_buffer;

void render()
{
    static int frame_count = 0;
    int subresource_id = frame_count % N;
    ++frame_count;

    // start of critical section
    NotifyResourceBeginAllAccess(frame_list);

    // render frame
    set_render_target(frame_list.sub_resource(subresource_id));
    render_scene();

    // signal transfer
    NotifyResourceEndWrites(frame_list, subresource_id);

    // compute average
    set_render_target(average);
    compute_average(frame_list);

    // end of critical section
    NotifyResourceEndAllAccess(frame_list);

    // remaining rendering
    set_render_target(back_buffer);
    finalize_rendering();
}

Note that frame_list is created with a broadcast flag because the update needs to be visible to all GPUs. In the case of two GPUs it is faster to replace AFR_TRANSFER_2STEP_WITH_BROADCAST with AFR_TRANSFER_1STEP_P2P . Information about querying the number of GPUs is described in the Crossfire guide.

Reducing the contention of the critical section

Let us now imagine that the function render_scene takes a long time to execute. NotifyResourceBeginAllAccess and NotifyResourceEndAllAccess are used to protect frame_list from updates initiated by another GPU. The long execution time of render_scene causes frame_list to be locked for a long time. In parallel programming it is well known that locks should be avoided as much as possible. In the case where the lock cannot be avoided the resulting critical section has to be reduced to a minimum.

In our example we can reduce the critical section by rendering the scene into a temporary render target and then copy the result into frame_list . This way NotifyResourceBeginAllAccess is called after render_scene . The pseudo code becomes:


render_target_texture_array frame_list{N}; // created with AFR_TRANSFER_2STEP_WITH_BROADCAST
render_target average; // created with AGS_AFR_TRANSFER_DISABLE
render_target scene; // created with AGS_AFR_TRANSFER_DISABLE
render_target back_buffer;

void render()
{
    static int frame_count = 0;
    int subresource_id = frame_count % N;
    ++frame_count;

    // render frame
    set_render_target(scene);
    render_scene();

    // start of critical section
    NotifyResourceBeginAllAccess(frame_list);
    // local transfer
    copy_subresource(frame_list, subresource_id, scene);
    // signal transfer
    NotifyResourceEndWrites(frame_list, subresource_id);

    // compute average
    set_render_target(average);
    compute_average(frame_list);

    // end of critical section
    NotifyResourceEndAllAccess(frame_list);

    // remaining rendering
    set_render_target(back_buffer);
    finalize_rendering();
}

The function copy_subresource is used to copy the render target scene into frame_list at layer subresource_id .

Further optimization

Now let us consider that the function compute_average is as slow as the function render_scene . The goal is to reduce the critical section by calling NotifyResourceEndAllAccess before compute_average . This can be done by releasing frame_list earlier and using a copy of frame_list for the average computation. The pseudo code becomes:


render_target_texture_array frame_list{N}; // created with AFR_TRANSFER_2STEP_WITH_BROADCAST
render_target average; // created with AGS_AFR_TRANSFER_DISABLE
render_target scene; // created with AGS_AFR_TRANSFER_DISABLE
render_target_texture_array frame_list_local_cpy{N}; // created with AGS_AFR_TRANSFER_DISABLE
render_target back_buffer;

void render()
{
    static int frame_count = 0;
    int subresource_id = frame_count % N;
    ++frame_count;

    // render frame
    set_render_target(scene);
    render_scene();

    // start of critical section
    NotifyResourceBeginAllAccess(frame_list);
    // local transfer
    copy_subresource(frame_list, subresource_id, scene);
    // signal transfer
    NotifyResourceEndWrites(frame_list, subresource_id);

    // local transfer
    copy_all_resource(frame_list_local_cpy, frame_list);
    // end of critical section
    NotifyResourceEndAllAccess(frame_list);

    // compute average
    set_render_target(average);
    compute_average(frame_list_local_cpy);

    // remaining rendering
    set_render_target(back_buffer);
    finalize_rendering();
}

frame_list_local_cpy is a local copy of frame_list within the frame. The copy is done with the function copy_all_resource . Note that all the content of frame_list is copied in frame_list_local_cpy . This is because any layer of frame_list could have been updated from a different GPU. After NotifyResourceEndAllAccess another gpu can transfer data to frame_list while frame_list_local_cpy is used to compute the average.

The guide along with a code sample gives detail about the API and demonstrates its use in a practical situation.


Anas Lasram is a developer technology engineer at AMD. Links to third party sites, and references to third party trademarks, are provided for convenience and illustrative purposes only. Unless explicitly stated, AMD is not responsible for the contents of such links, and no third party endorsement of AMD or any of its products is implied.

The post AMD Crossfire API appeared first on GPUOpen.

Fast compaction with mbcnt

$
0
0

Compaction is a basic building block of many algorithms – for instance, filtering out invisible triangles as seen in Optimizing the Graphics Pipeline with Compute. The basic way to implement a compaction on GPUs relies on atomics: every lane which has an element that must be kept increments an atomic counter and writes into that slot. While this works, it’s inefficient as it requires lots of atomic operations – one par active lane. The general pattern looks similar to the following pseudo-code:


if (threadId == 0) {
    sharedCounter = 0;
}

barrier ();

bool laneActive = predicate (item);

if (laneActive) {
    int outputSlot = atomicAdd (sharedCounter, 1);
    output [outputSlot] = item;
}

This computes an output slot for every item by incrementing a counter stored in Local Data Store (LDS) memory (called Thread Group Shared Memory in Direct3D® terminology). While this method works for any thread group size, it’s inefficient as we may end up with up to 64 atomic operations per wavefront.

With the newly released shader extensions, we’re providing access to a much better tool to get this job done: GCN provides a special op-code for compaction within a wavefront – mbcnt. mbcnt(v) computes the bit count of the provided value up to the current lane id. That is, for lane 0, it simply returns popcount (v & 0), for lane 1, it’s popcount (v & 1), for lane 2, popcount (v & 3), and so on. If you’re wondering what popcount does – it simply counts the number of set bits. The popcount result gives us the same result as the atomic operation above – a unique output slot within the wavefront we can write to. This leaves us with one more problem – we need to gather the laneActive variable which is per-thread across the whole wavefront.

We’ll need a short trip into the GCN execution model to understand how this works. In GCN, there’s a scalar unit and a vector unit. Any kind of comparison which is performed per-lane writes into a scalar register with one bit per lane. We can access this scalar register using ballot – in this case, we’re going to call mbcnt (ballot (laneActive)). The complete shader looks like this:


bool laneActive = predicate (item);
int outputSlot = mbcnt (ballot (laneActive));

if (laneActive) {
    output [outputSlot] = item;
}

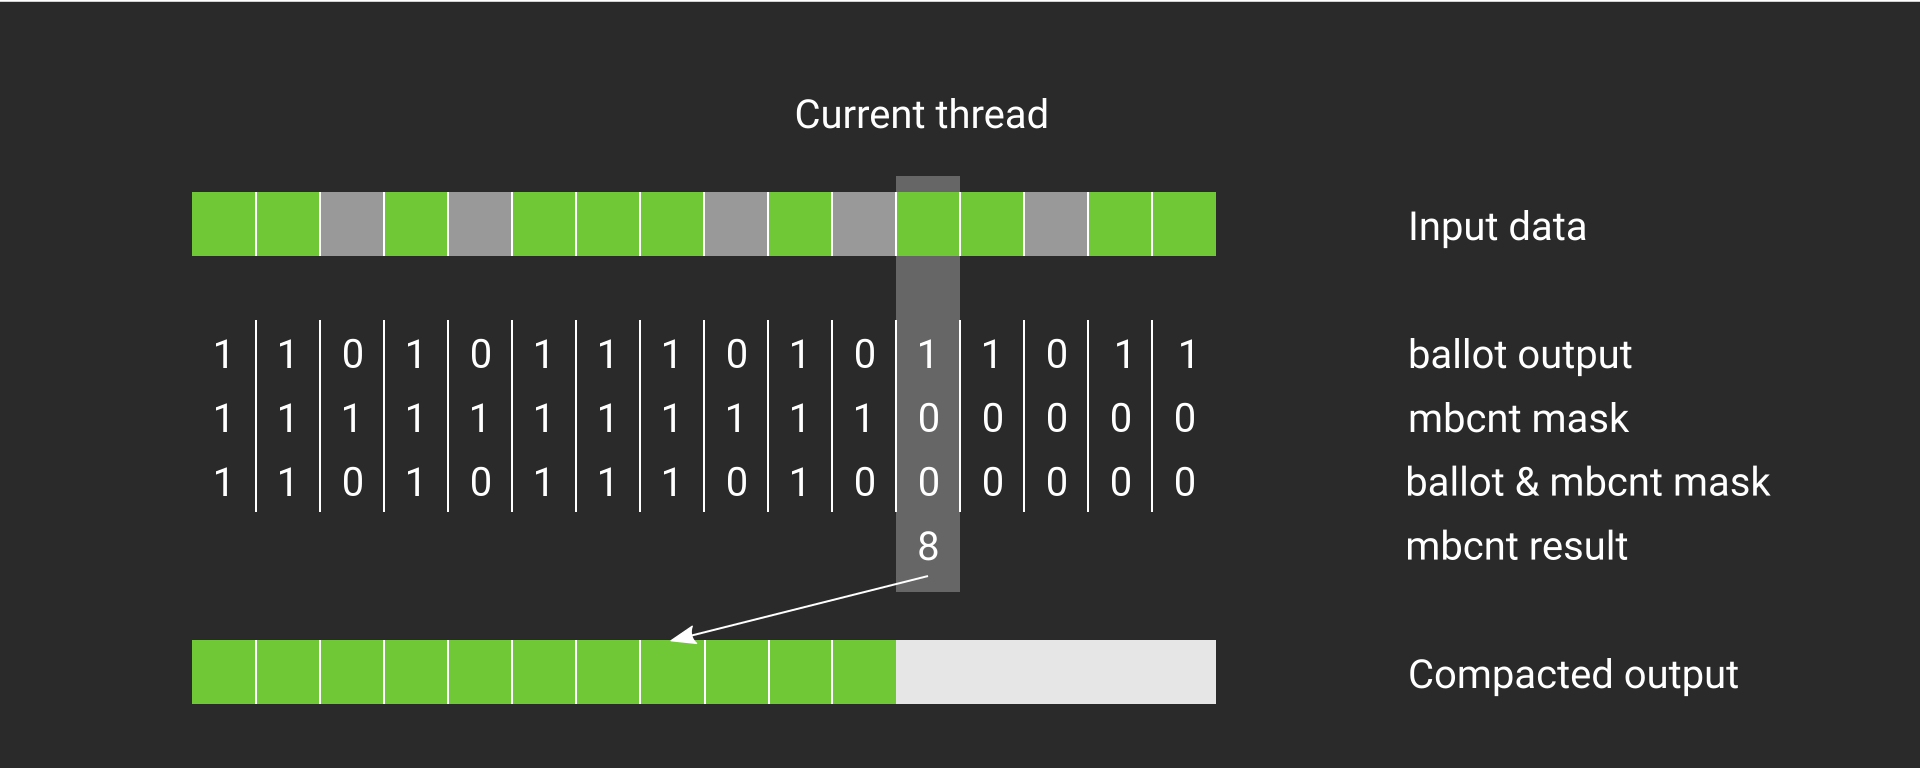
Much shorter than before, and also quite a bit faster. Let’s take a closer look how this works. In the image below, we can see the computation for one thread. The input data is green where items should be kept. The ballot output returns a mask which is 1 if the thread passed in true and 0 otherwise. This ballot mask is then AND’ed together during the mbcnt with a mask that has 1 for all bits less than the current thread index, and 0 otherwise. After the AND, mbcnt computes a popcount which yields the correct output slot.

The input data is filtered using mbcnt. The currently active thread is highlighted. For this thread, mbcnt applied onto the output of ballot returns the output slot that should be used during compaction.

Notice that this piece of code will be only equivalent if your dispatch size is 64. For other sizes, you’ll need an atomic per wavefront – which cuts down the number of atomics by 64 compared to the naive approach. The pattern you’d use looks like this:


if (wavefrontThreadId == 0) {
    sharedCounter = 0;
}

barrier ();

bool laneActive = predicate (item);
int outputSlot = mbcnt (ballot (laneActive));

if (wavefrontThreadId == 0) {
    sharedWavefrontOutputSlot = atomicAdd (sharedCounter,
        popcount (ballot (laneActive)));
}
barrier ();

if (laneActive) {
    output [sharedWavefrontOutputSlot + outputSlot] = item;
}

And finally, if you are going over the data with multiple thread groups, you’ll need a global atomic as well. In this case, the pattern looks as follows (assuming globalCounter has been cleared to zero before the dispatch starts):


if (wavefrontThreadId == 0) {
    sharedCounter = 0;
}

barrier ();

bool laneActive = predicate (item);
int outputSlot = mbcnt (ballot (laneActive));

if (wavefrontThreadId == 0) {
    sharedWavefrontOutputSlot = atomicAdd (sharedCounter,
        popcount (ballot (laneActive)));
}
barrier ();

// This is a shared variable as well. readlane is not sufficient, as
// we need to communicate across all invocations
if (workgroupThreadId == 0) {
    sharedSlot = atomicAdd (globalCounter, sharedCounter);
}
barrier ();

if (laneActive) {
    output [sharedWavefrontOutputSlot + outputSlot + sharedSlot] = item;
}

The “big picture” can be seen below. Depending on the level you’re working on, you should use the right atomics. At the global level, where you need to synchronize between work groups, you have to use global memory atomics. At the work group level, where you need to synchronize between wavefronts, local atomics are sufficient. Finally, at the wavefront level, you should take advantage of the wavefront functions like mbcnt.

TestC
Each dispatch level requires a different function. For whole work groups within a dispatch, output memory would be reserved using a global memory atomic. Within a work group, a local memory atomic is sufficient, and within a wavefront, mbcnt is the faster function.

I you want to try this out right now – we’ve got you covered and have a sample prepared for you!

Matthäus Chajdas is a developer technology engineer at AMD. Links to third party sites, and references to third party trademarks, are provided for convenience and illustrative purposes only. Unless explicitly stated, AMD is not responsible for the contents of such links, and no third party endorsement of AMD or any of its products is implied.

The post Fast compaction with mbcnt appeared first on GPUOpen.

ROCm With Harmony: Combining OpenCL, HCC, and HSA in a Single Program

$
0
0

Introduction

In a previous blog we discussed the different languages available on the ROCm platform.  Here we’ll show you how to combine several of these languages in a single program:

  • We’ll use an offline OpenCL™ compiler to compile the “BitonicSort” OpenCL kernel (from the AMD APP SDK) into a standard HSA code object (“hsaco”) format.
  • The host code will employ HCC’s hc dialect for device discovery (ie hc::accelerator and hc::accelerator_view ) and memory management ( hc::array )
  • The actual dispatch will use the low-level HSA Runtime calls.  Recall that ROCR is an implementation of the HSA Runtime with extensions for multi-GPU configurations.   We’ll show you how to extract HSA queue and agent structures from the HCC C++ ones, and then use them to perform the kernel launch.

There are several reasons you might want to do something along these lines. First, many kernels exist in OpenCL and re-using this existing investment can save time.  The OpenCL kernel language is widely-used, and it enables programmers to use advanced GPU features including local memory, rich math functions, and vector operations.   But the OpenCL runtime can be verbose and the memory interface can be difficult to control and optimize. HCC provides the advantage of a full C++ runtime but also full control over the memory allocation and copies.  Using the techniques we’ll show you here, you can employ OpenCL kernels without having to port the host runtime code to OpenCL. This approach offers a significant advantage for larger C++ programs that can use a few optimized OpenCL kernels while sticking with C++ kernels and features for the rest of the program.

hsaco : The Common Currency

Hsaco is informally pronounced “sock-o” (with a slight emphasis on the first letter to reflect the otherwise silent “h”).  It’s a standard ELF file ; ELF (“Executable and Linkable Format”) is a container format widely used in Linux to store object code, and the hsaco ELF container organization matches the one generated by the popular LLVM tool chain.  Hsaco stores the compiled GCN code in the .text section, it optionally contains debug information, and it defines symbols that allow the host code to find the kernel entrypoints and functions.  Like other ELF files, code objects can contain multiple kernels, functions, and data – so when using hsaco you will need to specify both the code object and the desired symbol.  Refer to the detailed description of the hsaco format for more information.

Many tools in AMD’s compiler chain generate and use the hsaco format including  OpenCL, HCC, HIP, the GCN assembler and the HSAIL Finalizer.  Kernel code contained in hsaco can be extracted and then launched onto the GPU.    Additionally, the dissembler tool can disassemble hsaco files so you can see what is going on inside the kernel.  In a future blog, we’ll talk about using the same techniques described here to assemble and then launch kernels written in GCN assembly.  Essentially, hsaco is the interchange format used to pass code between these different tools, and allows code written in different languages to be used together.

Compiling an OpenCL Kernel into hsaco

The Makefile shows the usage of the CLOC (CL Offline Compiler) tool to compile the CL kernel into the hsaco file.  Here’s the relevant call to CLOC:

/opt/rocm/cloc/bin/cloc.sh BitonicSort_Kernels.cl -o BitonicSort_Kernels.hsaco

Using hsaco:

This example shows two methods for accessing the hsaco data from the host application :

  • Use a separate file and load it using C++ file I/O code. See the load_hsa_from_file() command. This path is enabled when p_loadKernelFromFile=true.
  • Serialize the code into a global string and thus directly link the hsaco into the executable. This approach avoids the need to find the hsaco file at runtime.  This path is enabled when p_loadKernelFromFile=false.

The “load_hsa_code_object” shows the use of the standard HSA Runtime API calls to load the code object into memory and extract the pointer to the BitonicSort kernel.  If we were working with an HSAIL or BRIG kernel we would first call the finalizer which would produce hsaco data, and the use these exact same finalizer APIs to load the hsaco into memory and find the desired symbols.    This is a powerful and extremely useful concept that allows applications using the HSA Runtime to support either:

  • An industry standard portable intermediate language (HSAIL/BRIG) that can be finalized to a vendor-specific binary, or
  • A standard ELF container that stores vendor-specific binary code (hsaco). This flavor supports vendor-specific ISA inside a standard container format, and still benefits from the standard HSA runtime API.  Effectively this enables use cases where apps and tools can use the HSA Runtime APIs without using HSAIL, and still retain source code portability.

The picture below shows the different steps in the code loading process, and in particular the clean separation between the pre-finalization (green) and post-finalization (yellow) steps.

finalizer executable hsail flow

Making HCC Sing

The example uses the hc C++ dialect to select the default accelerator and queue.  To launch the hsaco file we’ve created, we need to make HCC reveal the details of the HSA data structure that live under the covers. Here’s the critical piece of code that shows how to get from the HCC world to the HSA world using “hc::accelerator_view::get_hsa_queue”:


//_acc is type hc::accelerator. // Select default queue hc::accelerator_view av = _acc.get_default_view(); // Extract the HSA queue from the accelerator view:
hsa_queue_t  *hsaQueue = static_cast<hsa_queue_t*> (av.get_hsa_queue());

Now that we have an HSA queue we can use the low-level HSA runtime API to enqueue the kernel for execution on the GPU. The code creates an “AQL” packet, uses the hsa runtime APIs (such as hsa_queue_store_write_index_relaxed) to place the packet into the queue and make it visible to the GPU for execution. More details in the code.

This capability is a quite useful since we can now mix HCC kernels (submitted with parallel_for_each) with kernels in hsaco format (from OpenCL kernels, or assembly, or other sources) in the same application or even in the same queue.   For example, libraries can benefit from this architecture : the library interface can be based on HCC structures (accelerator, accelerator_view, completion_future) while the implementation uses HSA Runtime and hsacos.

Extracting Data Pointers

The example under discussion uses   hc::array<> to store the array of integers that are sorted.  The original OpenCL kernel of course knows nothing of the   hc::array<> data-type.  Here’s the OpenCL kernel signature:


__kernel
void bitonicSort(__global uint * theArray, const uint stage, const uint passOfStage, const uint direction)

When calling this kernel, the first parameter (theArray) is an 8-byte pointer.  Fortunately the hc syntax defines an API that allows us to retrieve this pointer on the host side so we can later pass it to the kernel in the expected position:


_inputAccPtr = _inputArray->;accelerator_pointer();


Our application is still responsible for ensuring that the data at this pointer is valid on the accelerator, before calling the kernel.   In this case, the application copies from host data (allocated with malloc) to the inputArray.

The code also shows the use of hc’s accelerator memory interface to allocate and copy the data.  This is an alternative to using hc::array<> , and can be select by setting p_useHcArray=false in the top of the source code.  Here’s the relevant code snippet:

 // Alternative allocation technique using am_alloc
_inputAccPtr = hc::am_alloc(sizeBytes, _acc, 0);
hc::am_copy(_inputAccPtr, _input, sizeBytes);

We do not recommended usinge   hc::array_view<> with the direct hsaco code launching techniques we are discussing here.   hc::array_view<> is designed to automatically synchronize the data before and after parallel_for_each blocks are launched.  Direct launching with HSA runtime APIs will not automatically synchronize  hc::array_view<> .

Finally, HCC provides accessors that allow easy retrieval of the the HSA “regions” associated with an accelerator.  The HSA runtime API uses regions to specify where memory on an agent is located – for example coarse-grain device memory or fine-grain system memory.    When enumerating accelerators, HCC scans the supported regions for each underlying HSA agent and provides the following accessors:


void* get_hsa_am_region();// Accelerator-memory region.  On discrete GPUs its the device memory ; on APUs its shared host memory
void* get_hsa_am_system_region() // Pinned or registered host memory accessible to this accelerator
void* get_hsa_kernarg_region() // Memory for kernel arguments.

This example uses get_hsa_kernarg_region() to allocate memory for the kernel arguments passed to the BitonicSort kernel.  Kernarg memory is typically written by the host CPU and read by the accelerator executing the kernel.  The example defines a host-side structure to describe the layout of the arguments expected by the kernel, and then typecasts the pointer returned by the kernarg pointer.


/*
* This is the host-side representation of the kernel arguments expected by the BitonicSort kernel.
* The format and alignment for this structure must exactly match the kernel signature defined in the kernel
*/
struct BitonicSort_args_t {
uint32_t * theArray;
uint32_t stage;
uint32_t passOfStage;
uint32_t direction;
} ;
 
/*
* Allocate the kernel argument buffer from the correct region.
*/
BitonicSort_args_t * args = NULL;
hsa_region_t kernarg_region = *(static_cast<hsa_region_t*> (_acc.get_hsa_kernarg_region()));
hsa_status = hsa_memory_allocate(kernarg_region, sizeof(args), (void**)(&args));
aql.kernarg_address = args;
assert(HSA_STATUS_SUCCESS == hsa_status);
 
/*
* Write the args directly into the kernargs buffer:
*/
args->theArray = _inputAccPtr;
args->stage = 0;
args->passOfStage = 0;
args->direction = _sortIncreasing;

Summary

We learned how to use offline compilation to convert an OpenCL kernel into a standard hsaco file and then employed the HSA Runtime API to launch that kernel from an HCC program.  Harmony!  In the future we’ll look at how to optimize the HSA Runtime calls, and also how to use other tools to create hsaco files (such as the AMDGCN assembler).   Stay tuned.

Reference:

GitHub Code for this example

https://en.wikipedia.org/wiki/Bitonic_sorter

Ben Sander is a Senior Fellow at AMD and the lead software architect for the ROCm (aka Boltzmann) and HSA projects. He has held a variety of management and leadership roles during his career at AMD including positions in CPU micro-architecture, performance modeling, and GPU software development and optimization. Links to third party sites are provided for convenience and unless explicitly stated, AMD is not responsible for the contents of such linked sites and no endorsement is implied.

The post ROCm With Harmony: Combining OpenCL, HCC, and HSA in a Single Program appeared first on GPUOpen.

ROCm with Rapid Harmony : Optimizing HSA Dispatch

$
0
0

We previously looked at how to launch an OpenCL™ kernel using the HSA runtime. That example showed the basics of using the HSA Runtime. Here we’ll turn up the tempo a bit by optimizing the launch code – moving some expensive operations into the setup code (rather than on each dispatch), removing host-side synchronization, and optimizing the memory fences to the bare minimum required.  We’ll measure the contributions of the different optimizations and discuss the results.   The code is available at the same GitHub repository as before and the optimizations can be enabled with a series of command-line switches.

Optimizing

Bitonic sort involves running the same kernel several times. For the default array length of 32768, the algorithm launches 120 kernels.  The original OpenCL code and the associated port used in the example synchronize with the host after each of the kernel code.  To improve performance, we can submit all 120 kernels at one time, and only synchronize with the host after the last one completes.

To make this change, we will need to restructure the BitonicSort::run call as follows:

  • Each kernel still needs to wait for the previous kernel to finish executing. The AQL packet in the HSA system architecture defines a “barrier” bit which provides exactly this synchronization – packets with the barrier bit set will wait for all preceding kernels in the same queue to complete before beginning their own execution.  Barrier-bit synchronization only works for commands in the same queue, but will be more efficient than using signals in the cases where it applies.  So we’ll set the barrier bit for all the kernels to provide the required synchronization between kernels, and therefore will only need to use a completion_signal for the last kernel in the sequence.  (all other kernels set the completion_signal to 0, which saves an atomic decrement operation when the command finishes. )  This optimization is marked with p_optPreallocSignal.
  • In HSA, each kernel submission requires a block of “kernarg” memory to hold the kernel arguments. The  baseline implementation allocates a single kernarg block and re-uses it for each kernel submission.  In the optimized version, we submit all the kernels at the same time, but with different kernel arguments, so we must ensure that each kernel has its own kernarg block.  The code actually performs a single kernarg allocation with enough space to cover all of the inflight kernels.   Additionally, the code aligns each kernarg block on a 64-byte cache line boundary.  This avoids false-sharing cases where the GPU is reading kernargs for one command while the host is writing arguments for another kernel, causing the cache line to ping-pong between CPU and GPU caches.   The kernarg optimizations are marked with p_optPreallocKernarg.
  • The function bitonicSortGPU_opt contains the optimized loop which submits the batch of 120 kernels to the GPU.  This code is marked with o_optAvoidHostSync).
  • Each AQL kernel dispatch packet contains a field that controls the memory fences applied before and after the kernel executes.  In the baseline implementation, the fences conservatively specify system visibility for both acquire and release fences.  (The subject of fences and what they control is well beyond the scope of this document but it covered extensively in the HSA System Architecture Specification Memory Model.  It turns out we can make a more surgical use of these fences in the optimized version: (code marked with p_optFence)
    • The first kernel needs a system acquire fence to make sure it gets the data from the host->device copy.
    • The last kernel needs a system release fence to make sure it releases the data for the device->host copy.
    • All of the intermediate kernels only need to use “agent” level fences.  On the AMD Fiji hardware, agent-scope fences are significantly faster than system-scope fences since the former flush only the L1 caches while the latter flush both the L1 and the L2 caches.
    
    
    // Optimize HSA Fences
    if (p_optFence) {
        aql.header =
            (HSA_PACKET_TYPE_KERNEL_DISPATCH << HSA_PACKET_HEADER_TYPE) |
             (1 << HSA_PACKET_HEADER_BARRIER);
        bool setFence=false;


       if (kernelCount == 1) {
            // first packet needs to acquire from system to make sure it gets the host->device copy:
            aql.header |= (HSA_FENCE_SCOPE_SYSTEM << HSA_PACKET_HEADER_ACQUIRE_FENCE_SCOPE);
            aql.header |= (HSA_FENCE_SCOPE_AGENT << HSA_PACKET_HEADER_RELEASE_FENCE_SCOPE); setFence = true;
        }
    
        if (kernelCount == numKernels) {
            // last packet needs to release to system to make sure data is visible for device->host copy:
            aql.header |= (HSA_FENCE_SCOPE_AGENT << HSA_PACKET_HEADER_ACQUIRE_FENCE_SCOPE);
            aql.header |= (HSA_FENCE_SCOPE_SYSTEM << HSA_PACKET_HEADER_RELEASE_FENCE_SCOPE);
            setFence = true;
        }
    
        if (!setFence) {
            // fences at agent scope:
            aql.header |= (HSA_FENCE_SCOPE_AGENT << HSA_PACKET_HEADER_ACQUIRE_FENCE_SCOPE);
            aql.header |= (HSA_FENCE_SCOPE_AGENT << HSA_PACKET_HEADER_RELEASE_FENCE_SCOPE);
        }
    }
  • The flag p_optPinHost uses hc::am_alloc with the amPinnedHost flag to allocate pinned host memory.  Pinned host memory accelerates the data transfer operations since the runtime will identify that the memory is already pinned and thus immediately start the DMA transactions – this achieves a peak transfer rate of 13-14GB/s.    Unpinned memory is transferred through a host-side staging buffer and can be transferred at 6-7GB/s.

Results

After making these changes, we see the speedups shown in the chart and table below.

perf-data

The timing numbers shown here includes the time to transfer the array to the GPU, run all of the kenrels, and transfer back the result.  The numbers do not include time spent initializing the runtime, allocating memory, or performing the result verification.  The times show the time required to sort 32768 integers using 120 kernels.  This is relatively small size to offload to the GPU (only 128K) and as a result the kernels run in 3-4 us, which stresses the HSA runtime features that we want to discuss.

Baseline +optPreallocSignal +optPreallocKernarg +optAvoidHostSync +optFence +optPinnedHost
RunTime/Iteration (us) 1943 1906 1869 1665 1221 1137
Delta/Iteration(us) -37 -37 -204 -444 -84

The results show that signal allocation and kernarg allocation both take approximately 37us to complete, which makes sense since both operations require a trip into kernel space (ROCK) and perform memory allocation.  Even the baseline operation shares the signal and kernarg allocation for all 120 kernels but the overhead here is still significant.  Kernels can be dispatched in 5-10us each, so optimal programs definitely will want to perform these operations outside of the critical path.  The optimized code path here moves these operations into the setup routine.  Another option is to create a buffer pool of signals and kernargs (this is the approach used by HCC) or to use thread-local-storage (if thread-safety is required).

Avoiding the host synchronization saves 204us, or about 1.7us per kernel.

The system-scope fences are fairly expensive – Fiji has a 2MB L2 cache, and it takes 3-4 us to flush the entire thing.  Additionally, the bitonic kernel default size is only 128K (32K elements * 4 bytes/element)  which can easily fit in the L2 cache.  Each kernel in the sequence then reads from the L2 and writes the data back to it.  By optimizing these fences to use AGENT scope when possible, we are able to save approximately 3.7us per kernel launch.

Finally, using pinned host memory improves the transfer speeds from around 6GB/s to 14GB/s.    In this workload, we see a modest performance improvement (84us) since most of the benchmark is spent running the kernels and synchronizing between them.

Overall the performance improvement from these optimizations is 1.7X faster than the baseline version.


Reference:

Wikipedia has a nice description of the Bitonic sort algorithm, including pictures.

Eric Bainville wrote a nice explanation here describing how to optimize Bitonic Sort for the GPU.

Ben Sander is a Senior Fellow at AMD and the lead software architect for the ROCm (aka Boltzmann) and HSA projects. He has held a variety of management and leadership roles during his career at AMD including positions in CPU micro-architecture, performance modeling, and GPU software development and optimization. Links to third party sites are provided for convenience and unless explicitly stated, AMD is not responsible for the contents of such linked sites and no endorsement is implied.

The post ROCm with Rapid Harmony : Optimizing HSA Dispatch appeared first on GPUOpen.

The Art of AMDGCN Assembly: How to Bend the Machine to Your Will

$
0
0

The ability to write code in assembly is essential to achieving the best performance for a GPU program. In a previous blog we described how to combine several languages in a single program using ROCm and Hsaco. This article explains how to produce Hsaco from assembly code and also takes a closer look at some new features of the GCN architecture. I’d like to thank Ilya Perminov of Luxsoft for co-authoring this blog post.

Programs written for GPUs should achieve the highest performance possible. Even carefully written ones, however, won’t always employ 100% of the GPU’s capabilities. Some reasons are the following:

  • The program may be written in a high level language that does not expose all of the features available on the hardware.
  • The compiler is unable to produce optimal ISA code, either because the compiler needs to ‘play it safe’ while adhering to the semantics of a language or because the compiler itself is generating un-optimized code.

Consider a program that uses one of GCN’s new features (source code is available on GitHub). Recent hardware architecture updates—DPP and DS Permute instructions—enable efficient data sharing between wavefront lanes. To become more familiar with the instruction set, review the GCN ISA Reference Guide.

Note: the assembler is currently experimental; some of syntax we describe may change.

DS Permute Instructions

Two new instructions, ds_permute_b32 and ds_bpermute_b32 , allow VGPR data to move between lanes on the basis of an index from another VGPR. These instructions use LDS hardware to route data between the 64 lanes, but they don’t write to LDS memory. The difference between them is what to index: the source-lane ID or the destination-lane ID. In other words, ds_permute_b32 says “put my lane data in lane i,” and ds_bpermute_b32 says “read data from lane i.” The GCN ISA Reference Guide provides a more formal description.

The test kernel is simple: read the initial data and indices from memory into GPRs, do the permutation in the GPRs and write the data back to memory. An analogous OpenCL kernel would have this form:


__kernel void hello_world(__global const uint * in, __global const uint * index, __global uint * out)
{
     size_t i = get_global_id(0);
     out[i] = in[ index[i] ];
}

Passing Parameters to a Kernel

Formal HSA arguments are passed to a kernel using a special read-only memory segment called kernarg . Before a wavefront starts, the base address of the kernarg segment is written to an SGPR pair. The memory layout of variables in kernarg must employ the same order as the list of kernel formal arguments, starting at offset 0, with no padding between variables—except to honor the requirements of natural alignment and any align qualifier.

The example host program must create the kernarg segment and fill it with the buffer base addresses. The HSA host code might look like the following:


/*
* This is the host-side representation of the kernel arguments that the simplePermute kernel expects.
*/
struct simplePermute_args_t {
	uint32_t * in;
	uint32_t * index;
	uint32_t * out;
};
/*
* Allocate the kernel-argument buffer from the correct region.
*/
hsa_status_t status;
simplePermute_args_t * args = NULL;
status = hsa_memory_allocate(kernarg_region, sizeof(simplePermute_args_t), (void**)(&args));
assert(HSA_STATUS_SUCCESS == status);
aql->kernarg_address = args;
/*
* Write the args directly to the kernargs buffer;
* the code assumes that memory is already allocated for the 
* buffers that in_ptr, index_ptr and out_ptr point to
*/
args->in = in_ptr;
args->index = index_ptr;
args->out = out_ptr;

The host program should also allocate memory for the in , index and out buffers. In the GitHub repository, all the run-time-related stuff is hidden in the Dispatch and Buffer classes, so the sample code looks much cleaner:


// Create Kernarg segment
if (!AllocateKernarg(3 * sizeof(void*))) { return false; }

// Create buffers
Buffer *in, *index, *out;
in = AllocateBuffer(size);
index = AllocateBuffer(size);
out = AllocateBuffer(size);

// Fill Kernarg memory
Kernarg(in); // Add base pointer to “in” buffer
Kernarg(index); // Append base pointer to “index” buffer
Kernarg(out); // Append base pointer to “out” buffer

Initial Wavefront and Register State

To launch a kernel in real hardware, the run time needs information about the kernel, such as

  • The LDS size
  • The number of GPRs
  • Which registers need initialization before the kernel starts

All this data resides in the amd_kernel_code_t structure. A full description of the structure is available in the AMDGPU-ABI specification. This is what it looks like in source code:


.hsa_code_object_version 2,0
.hsa_code_object_isa 8, 0, 3, "AMD", "AMDGPU"

.text
.p2align 8
.amdgpu_hsa_kernel hello_world

hello_world:

.amd_kernel_code_t
enable_sgpr_kernarg_segment_ptr = 1
is_ptr64 = 1
compute_pgm_rsrc1_vgprs = 1
compute_pgm_rsrc1_sgprs = 0
compute_pgm_rsrc2_user_sgpr = 2
kernarg_segment_byte_size = 24
wavefront_sgpr_count = 8
workitem_vgpr_count = 5
.end_amd_kernel_code_t

s_load_dwordx2  s[4:5], s[0:1], 0x10
s_load_dwordx4  s[0:3], s[0:1], 0x00
v_lshlrev_b32  v0, 2, v0
s_waitcnt     lgkmcnt(0)
v_add_u32     v1, vcc, s2, v0
v_mov_b32     v2, s3
v_addc_u32    v2, vcc, v2, 0, vcc
v_add_u32     v3, vcc, s0, v0
v_mov_b32     v4, s1
v_addc_u32    v4, vcc, v4, 0, vcc
flat_load_dword  v1, v[1:2]
flat_load_dword  v2, v[3:4]
s_waitcnt     vmcnt(0) & lgkmcnt(0)
v_lshlrev_b32  v1, 2, v1
ds_bpermute_b32  v1, v1, v2
v_add_u32     v3, vcc, s4, v0
v_mov_b32     v2, s5
v_addc_u32    v4, vcc, v2, 0, vcc
s_waitcnt     lgkmcnt(0)
flat_store_dword  v[3:4], v1
s_endpgm

Currently, a programmer must manually set all non-default values to provide the necessary information. Hopefully, this situation will change with new updates that bring automatic register counting and possibly a new syntax to fill that structure.

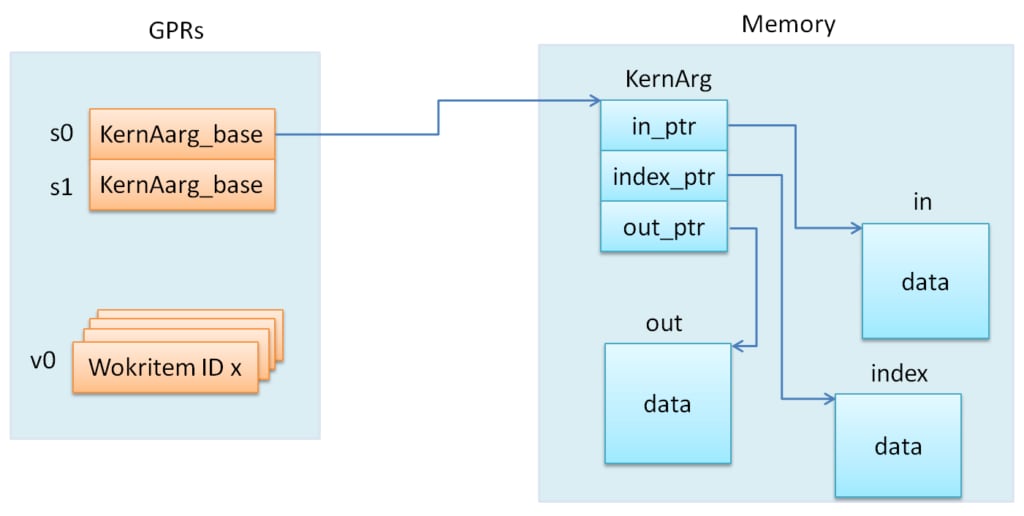
Before the start of every wavefront execution, the GPU sets up the register state on the basis of the enable_sgpr_* and enable_vgpr_* flags. VGPR v0 is always initialized with a work-item ID in the x dimension. Registers v1 and v2 can be initialized with work-item IDs in the y and z dimensions, respectively. Scalar GPRs can be initialized with a work-group ID and work-group count in each dimension, a dispatch ID, and pointers to kernarg , the aql packet, the aql queue, and so on. Again, the AMDGPU-ABI specification contains a full list in in the section on initial register state. For this example, a 64-bit base kernarg address will be stored in the s[0:1] registers (enable_sgpr_kernarg_segment_ptr = 1) , and the work-item thread ID will occupy v0 (by default). Below is the scheme showing initial state for our kernel.

initial_state

The GPR Counting

The next amd_kernel_code_t fields are obvious: is_ptr64 = 1 says we are in 64-bit mode, and kernarg_segment_byte_size = 24 describes the kernarg segment size. The GPR counting is less straightforward, however. The workitem_vgpr_count holds the number of vector registers that each work item uses, and wavefront_sgpr_count holds the number of scalar registers that a wavefront uses. The code above employs v0–v4 , so workitem_vgpr_count = 5 . But wavefront_sgpr_count = 8 even though the code only shows s0–s5 , since the special registers VCC , FLAT_SCRATCH and XNACK are physically stored as part of the wavefront’s SGPRs in the highest-numbered SGPRs. In this example, FLAT_SCRATCH and XNACK are disabled, so VCC has only two additional registers.

In current GCN3 hardware, VGPRs are allocated in groups of 4 registers and SGPRs in groups of 16. Previous generations (GCN1 and GCN2) have a VGPR granularity of 4 registers and an SGPR granularity of 8 registers. The fields compute_pgm_rsrc1_*gprs contain a device-specific number for each register-block type to allocate for a wavefront. As we said previously, future updates may enable automatic counting, but for now you can use following formulas for all three GCN GPU generations:


compute_pgm_rsrc1_vgprs = (workitem_vgpr_count-1)/4

compute_pgm_rsrc1_sgprs = (wavefront_sgpr_count-1)/8

Now consider the corresponding assembly:


// initial state:
//   s[0:1] - kernarg base address
//   v0 - workitem id

s_load_dwordx2  s[4:5], s[0:1], 0x10  // load out_ptr into s[4:5] from kernarg
s_load_dwordx4  s[0:3], s[0:1], 0x00  // load in_ptr into s[0:1] and index_ptr into s[2:3] from kernarg
v_lshlrev_b32  v0, 2, v0              // v0 *= 4;
s_waitcnt     lgkmcnt(0)              // wait for memory reads to finish

// compute address of corresponding element of index buffer
// i.e. v[1:2] = &index[workitem_id]
v_add_u32     v1, vcc, s2, v0
v_mov_b32     v2, s3
v_addc_u32    v2, vcc, v2, 0, vcc

// compute address of corresponding element of in buffer
// i.e. v[3:4] = &in[workitem_id]
v_add_u32     v3, vcc, s0, v0
v_mov_b32     v4, s1
v_addc_u32    v4, vcc, v4, 0, vcc

flat_load_dword  v1, v[1:2] // load index[workitem_id] into v1
flat_load_dword  v2, v[3:4] // load in[workitem_id] into v2
s_waitcnt     vmcnt(0) & lgkmcnt(0) // wait for memory reads to finish

// v1 *= 4; ds_bpermute_b32 uses byte offset and registers are dwords
v_lshlrev_b32  v1, 2, v1

// perform permutation
// temp[thread_id] = v2
// v1 = temp[v1]
// effectively we got v1 = in[index[thread_id]]
ds_bpermute_b32  v1, v1, v2

// compute address of corresponding element of out buffer
// i.e. v[3:4] = &out[workitem_id]
v_add_u32     v3, vcc, s4, v0
v_mov_b32     v2, s5
v_addc_u32    v4, vcc, v2, 0, vcc

s_waitcnt     lgkmcnt(0) // wait for permutation to finish

// store final value in out buffer, i.e. out[workitem_id] = v1
flat_store_dword  v[3:4], v1

s_endpgm

Compiling GCN ASM Kernel Into Hsaco

The next step is to produce a Hsaco from the ASM source. LLVM has added support for the AMDGCN assembler, so you can use Clang to do all the necessary magic:


clang -x assembler -target amdgcn--amdhsa -mcpu=fiji -c -o test.o asm_source.s

clang -target amdgcn--amdhsa test.o -o test.co

The first command assembles an object file from the assembly source, and the second one links everything (you could have multiple source files) into a Hsaco. Now, you can load and run kernels from that Hsaco in a program. The GitHub examples use Cmake to automatically compile ASM sources.

In a future post we will cover DPP, another GCN cross-lane feature that allows vector instructions to grab operands from a neighboring lane.

References

  1. GCN3 ISA
  2. Hsaco and amd_kernel_code_t description
  3. GitHub code with ASM examples

Ilya Perminov is a software engineer at Luxoft. He earned his PhD in computer graphics in 2014 from ITMO University in Saint Petersburg, Russia. Ilya interned at AMD in 2015, during which time he worked on graphics-workload tracing and performance modeling. His research interests include real-time rendering techniques, GPUs architecture and GPGPU.

Ben Sander is a Senior Fellow at AMD and the lead software architect for the ROCm (aka Boltzmann) and HSA projects. He has held a variety of management and leadership roles during his career at AMD including positions in CPU micro-architecture, performance modeling, and GPU software development and optimization. Links to third party sites are provided for convenience and unless explicitly stated, AMD is not responsible for the contents of such linked sites and no endorsement is implied.

The post The Art of AMDGCN Assembly: How to Bend the Machine to Your Will appeared first on GPUOpen.

Performance Tweets Series: Root signature & descriptor sets

$
0
0

Before Direct3D® 12 and Vulkan™, resources were bound to shaders through a “slot” system. Some of you might remember when hardware did have only very few fixed-function units which required you to bind a texture to the first unit and a light map to the second unit. The binding system in OpenGL® and Direct3D until version 11 shows this heritage. In both APIs, there’s a set of slots where you bind resource to, even though the hardware has evolved away from this model.

Before we go into the new binding model we’ll take a look at how a modern GCN based GPU identifies a resource. Let’s say we want to access a texture – how is this passed on to the texture sampling instruction? If we look at the GCN ISA documentation, we’ll find this paragraph:

All vector memory operations use an image resource constant (T#) that is a 128- or 256-bit value in SGPRs. This constant is sent to the texture cache when the instruction is executed. This constant defines the address, data format, and characteristics of the surface in memory.

So what used to be a slot is now a couple of registers, which are passed on to the texture sampling instruction. Even more interesting, the next sentence reads:

Typically, these constants are fetched from memory

This means that all we need to describe a texture is a small descriptor (128 or 256 bits) which can be placed anywhere in memory. As long as it can be loaded into registers, we’re good to go. If we read the rest of the documentation, we’ll notice that the same pattern is also used for all other resource types. In fact, there’s no “slot” to be found when it comes to resource access – instead, everything goes through a texture descriptor (or T#), a sampler descriptor (S#), or a constant (V#). With Direct3D 12 and Vulkan, those descriptors are finally exposed directly as what they are – some GPU memory.

On GCN hardware, there is a special set of registers — called “user registers” — available to store descriptors (and constants – more on this below.) The number of these registers available for descriptor storage varies depending on the shader stage, PSO and drivers, but in general it’s roughly a dozen. Each register can be pre-loaded with a descriptor, a constant, or a pointer. When the register space overflows, the driver emulates a larger table using a spill space in memory; this has both a CPU cost (managing the spill table – incurred every time the region that’s spilled changes) and a GPU cost (extra pointer indirection). As a result, if you have blocks of descriptors or constants that change in unison it’s often better to store them separately and use a pointer rather than causing them to spill.

Vulkan resource binding

In Vulkan, the binding model can be explained as follows. Descriptors are put into descriptor sets, and you bind one or more descriptor sets. Inside a descriptor set, you can freely mix all descriptor types. Additionally, there are “push constants” which are constants that you can pre-load into registers.

descriptor-set

Here’s an example of what this looks like. The block on the left is implicit in the API – you can’t see what is currently bound – and the blocks on the right-hand side are the individual descriptor sets. As we learned above, the descriptor sets are plain memory, so all advice regarding packing, cache hits and so on applies here as well. Put descriptors you’re going to use close together, try to load consecutive entries if possible, and avoid large jumps when accessing memory addresses. If you know in advance what sampler you’re going to use your texture with, you can optimize your descriptor set by fusing them together into a “combined image sampler” which puts the sampler and the texture close together.

You might be wondering about the dynamic buffer descriptors: those provide access to a buffer and an offset. They are basically a fused buffer descriptor with a plain constant. Those constants are going to use up registers therefore many dynamic buffers can become a problem. There are two ways you can work around this. If the data you’re indexing into has a uniform stride, just bind those buffers and index using a single constant into them (or multiple constants stored in another buffer.) If the stride is not fixed, but you know the offsets, you can create a descriptor array and index into that to jump to the target location. Again, make sure the index you use in the first place is a single constant or from another buffer.

Direct3D resource binding

Direct3D exposes implicit binding through a root signature, which is managed by the runtime. This maps pretty much directly on the user registers described above. There’s however a couple of limitations in the API: you can’t store sampler descriptors with other descriptors in a table. Additionally, in the root signature, you can only have pointers to descriptor tables, root signatures, and buffer pointers. You can’t put a texture or a sampler descriptor into the root signature, although one alternative may be to specify the sampler descriptors at compile time.

There’s also no fused texture descriptor/sampler descriptor; those have to be stored on separate descriptor heaps instead.

root-signature

Other than that, the binding model is the same as Vulkan’s, and requires that all resources are accessed through a descriptor. The main difference is the root signature which allows for certain kinds of descriptors to be stored in-line, while Vulkan expects you to go through a descriptor set in all cases.

Performance guidelines

The starting point for optimization is to keep the root signature as small as possible. A larger root signature means more chance of spill, and more entries for the driver to walk when validating parameters. That means, bind few descriptor tables, avoid setting large constants, and on Direct3D, don’t use the buffer views in the root signature if you can avoid it. A single constant buffer view may be acceptable, but you’re probably better off with a constant that provides you with an offset into a large constant buffer which is always bound. Let’s take a look at the root signature below:

root-signature-slow

It starts with a pointer, some root constants, some more pointers, and then two descriptors. Those two descriptors may be overflowing and then we end up in a driver managed overflow buffer. Make sure to make your root signature as compact as possible avoid this issue!

In any case, you should always strive to keep the most frequently changing parameters first in the list. If spills are in play their frequency will drop dramatically, and the driver overhead in validating parameters is likely to be less too. This allows the driver to keep overflow handling constant, and the most frequently changing entry will remain in registers for good performance.

That’s it for today! If you have questions, feel free to comment or ping us on Twitter: @NThibieroz & @NIV_Anteru.

Tweets

  • 07: Keep your root descriptor set small and place most frequently changed entries first.
  • 17: Order root signature parameters by change frequency (most frequent to least frequent).
  • 27: Keep your descriptor sets constant, reference resources that belong together in the same set.
  • 36: Use as few root signature slots as possible. Frequently updated slots should be grouped at the beginning of the signature
  • 44: Try to make root signatures as small as possible (create multiple root signatures if needs be).
  • 49: If using multiple root signatures, order/batch draw calls by root signature.
  • 54: Only constants or constant buffers changing every draw should be in the root signature.
Matthäus Chajdas is a developer technology engineer at AMD. Links to third party sites, and references to third party trademarks, are provided for convenience and illustrative purposes only. Unless explicitly stated, AMD is not responsible for the contents of such links, and no third party endorsement of AMD or any of its products is implied.

The post Performance Tweets Series: Root signature & descriptor sets appeared first on GPUOpen.

Vulkan Device Memory

$
0
0

EDIT: 2016/08/08 – Added section on Targeting Low-Memory GPUs

This post serves as a guide on how to best use the various Memory Heaps and Memory Types exposed in Vulkan on AMD drivers, starting with some high-level tips.

  • GPU Bulk Data
    Place GPU-side allocations in DEVICE_LOCAL without HOST_VISIBLE. Make sure to allocate the highest priority resources first like Render Targets and resources which get accessed more often. Once DEVICE_LOCAL fills up and allocations fail, have the lower priority allocations fall back to CPU-side memory if required via HOST_VISIBLE with HOST_COHERENT but without HOST_CACHED. When doing in-game reallocations (say for display resolution changes), make sure to fully free all allocations involved before attempting to make any new allocations. This can minimize the possibility that an allocation can fail to fit in the GPU-side heap.
  • CPU-to-GPU Data Flow
    For relatively small total allocation size (under 256 MB) the DEVICE_LOCAL with HOST_VISIBLE is the perfect Memory Type for CPU upload to GPU cases: the CPU can directly write into GPU memory which the GPU can then access without reading across the PCIe bus. This is great for upload of constant data, etc.
  • GPU-to-CPU Data Flow
    Use HOST_VISIBLE with HOST_COHERENT and HOST_CACHED. This is the only Memory Type which supports cached reads by the CPU. Great for cases like recording screen-captures, feeding back Hierarchical Z-Buffer occlusion tests, etc.

Pooling Allocations

EDIT: Great reminder from Axel Gneiting (leading Vulkan implementation in DOOM® at id Software), make sure to pool a group of resources, like textures and buffers, into a single memory allocation. On Windows® 7 for example, Vulkan memory allocations map to WDDM Allocations (the same lists seen in GPUView), and there is a relatively high cost associated for a WDDM Allocation as command buffers flow through the WDDM based driver stack. Having 256 MB per DEVICE_LOCAL allocation can be a good target, takes only 16 allocations to fill 4 GB.

Hidden Paging

When an application starts over-subscribing GPU-side memory, DEVICE_LOCAL memory allocations will fail. It is also possible that later during application execution, another application in the system increases its usage of GPU-side memory, resulting in dynamic over-subscribing of GPU-side memory. This case can result in an OS (for instance Windows® 7) to silently migrate or page GPU-side allocations to/from CPU-side as it time-slices execution of each application on the GPU. This can result in visible “hitching”. There is currently no method to directly query if the OS is migrating allocations in Vulkan. One possible workaround is for the app to detect hitching by looking at time-stamps, and then actively attempting to reduce DEVICE_LOCAL memory consumption when hitching is detected. For example, the application could manually move around resources to fully empty DEVICE_LOCAL allocations which can then be freed.

EDIT: Targeting Low-Memory GPUs

When targeting a memory surplus, using DEVICE_LOCAL+HOST_VISIBLE for CPU-write cases can bypass the need to schedule an extra copy. However in memory constrained situations it is much better to use DEVICE_LOCAL+HOST_VISIBLE as an extension to the DEVICE_LOCAL heap and use it for GPU Resources like Textures and Buffers. CPU-write cases can switch to HOST_VISIBLE+COHERENT. The number one priority for performance is keeping the high bandwidth access resources in GPU-side memory.

Memory Heap and  Memory Type – Technical Details

Driver Device Memory Heaps and Memory Types can be inspected using the Vulkan Hardware Database. For Windows AMD drivers, below is a breakdown of the characteristics and best usage models for all the Memory Types. Heap and Memory Type numbering is not guaranteed by the Vulkan Spec, so make sure to work from the Property Flags directly. Also note memory sizes reported in Vulkan represent the maximum amount which is shared across applications and driver.

  • Heap 0
    • VK_MEMORY_HEAP_DEVICE_LOCAL_BIT
    • Represents memory on the GPU device which can not be mapped into Host system memory
    • Using 256 MB per vkAllocateMemory() allocation is a good starting point for collections of buffers and images
    • Suggest using separate allocations for large allocations which might need to be resized (freed and reallocated) at run-time
    • Memory Type 0
      • VK_MEMORY_PROPERTY_DEVICE_LOCAL_BIT
      • Full speed read/write/atomic by GPU
      • No ability to use vkMapMemory() to map into Host system address space
      • Use for standard GPU-side data
  • Heap 1
    • VK_MEMORY_HEAP_DEVICE_LOCAL_BIT
    • Represents memory on the GPU device which can be mapped into Host system memory
    • Limited on Windows to 256 MB
      • Best to allocate at most 64 MB per vkAllocateMemory() allocation
      • Fall back to smaller allocations if necessary
    • Memory Type 1
      • VK_MEMORY_PROPERTY_DEVICE_LOCAL_BIT
      • VK_MEMORY_PROPERTY_HOST_VISIBLE_BIT
      • VK_MEMORY_PROPERTY_HOST_COHERENT_BIT
      • Full speed read/write/atomic by GPU
      • Ability to use vkMapMemory() to map into Host system address space
      • CPU writes are write-combined and write directly into GPU memory
        • Best to write full aligned cacheline sized chunks
      • CPU reads are uncached
        • Best to use Memory Type 3 instead for GPU write and CPU read cases
      • Use for dynamic buffer data to avoid an extra Host to Device copy
      • Use for a fall-back when Heap 0 runs out of space before resorting to Heap 2
  • Heap 2
    • Represents memory on the Host system which can be accessed by the GPU
    • Suggest using similar allocation size strategy as Heap 0
    • Ability to use vkMapMemory()
    • GPU reads for textures and buffers are cached in GPU L2
      • GPU L2 misses read across the PCIe bus to Host system memory
      • Higher latency and lower throughput on an L2 miss
    • GPU reads for index buffers are cached in GPU L2 in Tonga and later GPUs like FuryX
    • Memory Type 2
      • VK_MEMORY_PROPERTY_HOST_VISIBLE_BIT
      • VK_MEMORY_PROPERTY_HOST_COHERENT_BIT
      • CPU writes are write-combined
      • CPU reads are uncached
      • Use for staging for upload to GPU device
      • Can use as a fall-back when GPU device runs out of memory in Heap 0 and Heap 1
    • Memory Type 3
      • VK_MEMORY_PROPERTY_HOST_VISIBLE_BIT
      • VK_MEMORY_PROPERTY_HOST_COHERENT_BIT
      • VK_MEMORY_PROPERTY_HOST_CACHED_BIT
      • CPU reads and writes go through CPU cache hierarchy
      • GPU reads snoop CPU cache
      • Use for staging for download from GPU device

Choosing the correct Memory Heap and Memory Type is a critical task in optimization. A GPU like Radeon™ Fury X for instance has 512 GB/s of DEVICE_LOCAL bandwidth (sum of any ratio of read and write) but the PCIe bus supports at most 16 GB/s read and at most 16 GB/s write for a sum of 32 GB/s in both directions.

Timothy Lottes is a member of the Developer Technology Group at AMD. Links to third party sites are provided for convenience and unless explicitly stated, AMD is not responsible for the contents of such linked sites and no endorsement is implied.

The post Vulkan Device Memory appeared first on GPUOpen.

Anatomy Of The Total War Engine: Part II

$
0
0

We’re back again on this fine Warhammer Wednesday with more from Tamas Rabel, Lead Graphics Programmer on the Total War series. In last week’s post Tamas talked about the pipeline in their last game Total War: Attila. This week we’re going to take a peek inside Creative Assembly at one of the internal tools they developed to help measure frames in both DirectX®11 and DirectX 12. Tamas is also going to talk about one of the many tricks they used to optimize their shaders and why it delivered more performance on GCN hardware. Enjoy!

Measuring Performance

Before we can start working on any kind of optimization, we must have a way to measure the performance in a consistent way and then to drill down and understand the implications.

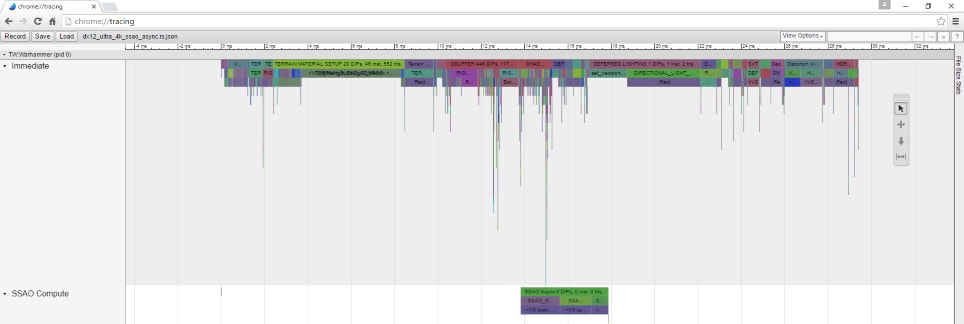
We do have a benchmark mode in the Total War games, which can reliable reproduce the same frames over and over. We also have a console with lots of dev commands, including one which captures all the device and rendering calls in a frame and measure them both on CPU and GPU.
Then we use a small ruby script to convert this data to chrome timeline format which can be displayed in chrome://tracing

Data to Chrome Timeline Format Which Can be Displayed in Chrome://tracing

This is how a typical scene in Total War: Warhammer looks like rendered at 4K. We use the timeline view first to find hotspots, then to validate our improvements by comparing results against previous captures we take with our internal tools.

Shader Register Usage

One of our most important tools in optimization was the shader analyser tool in CodeXL (and formerly GPUPerfStudio). The tool gives us information about register usage for the shaders used. I will walk you through the process of optimizing the pixel shader which combines the 8 layers of a terrain tiles. After running the shader through the analyser, this was our starting point:

Register Usage
Register Usage for The Shaders Used

Let me explain this a bit.

As we’re not using any additional LDS (Local Data Share) in our pixel shaders (beyond that used for our interpolants), the two resources that we care most about are SGPRs (Scalar General Purpose Register) and VGPRs (Vector General Purpose Register). From the view of a single thread (or a single pixel in this case) both types of register just contain a single 32-bit value. However, at the hardware-level GCN works on groups of 64 threads called wavefronts. From the point of view of a wavefront SGPRs are a single 32-bit values that is shared across all threads in the same wavefront. Conversely, VGPRs have a unique 32-bit value for each thread in the wavefront. One way to think of it is that any values that are constant across a group of 64 threads, for example the descriptors for your textures, can be stored in SGPRs while values that are (or have the potential to be) unique to each thread are stored in VGPRs.

VGPRS

From the point of view of a single thread each of the vector registers hold a single value. 256 VGPRs can mean 64 float4, 128 float2, 256 float or any combination of these. For example, if we sample a texture, but only use its RGB components and not its alpha channel, it will take up 3 VGPRs. Let’s do some math: we want to blend 8 terrain layers. Each layer has a diffuse, a normal and a spec/gloss texture. We use all 4 channels of the diffuse texture, 2 channels of the normal texture and 2 channels of the spec/gloss texture. That’s 4+2+2 = 8 VGPRs per layer. Multiplied by 8 layers is 64 VGPRs. So we’ve already used up a quarter of all the available registers in the SIMD and we haven’t even started to talk about other parts of the code, blend maps, height map, etc. Some registers can be reused, but as we’ll see soon it’s not as trivial as it seems.

The number of used registers is important, because modern hardware runs multiple wavefronts at the same time. You can think about this as processing multiple pixels at the same time. This means that one of the main limiting factors on the number of pixels we can have in flight is the number of registers the shaders require. If a single SIMD in the hardware has 256 VGPRs and a shader is using 200 of them for example, the GPU can work only on one wavefront at a time. After the first wavefront is launched on a SIMD it leaves 56 registers unused, which is not enough to accommodate another wavefront running the same shader. If it’s using 110 VGPRs, two wavefronts can run at the same time (112+112=224 and 32 registers remain unused). If the shader uses only 24 or less VGPRs, the hardware can run 10 wavefronts on a SIMD at the same time. 10 concurrent wavefronts is the current maximum for Fiji GPUs, such as the Radeon® Fury X. This limit is hard wired.

Back to the terrain shader, it was using 104 VGPRs. This means at most two wavefronts can be in flight at the same time, which is 128 pixels as we can have a maximum of 64 pixels in a single wavefront. Reducing the number or VGPRs can increase the number of wavefronts that can be active in parallel and can in some cases result in better performance.

So why are we using that many registers you may ask? We process the textures one by one, there is no need to keep all texture samples in registers all the time. Unfortunately, we don’t have control over how the shader compiler inside the driver translates DirectX Assembly to GCN ISA (which is the machine code for AMD GPUs), nor can we supply the GCN ISA directly (at least on PC). This means the shader compiler inside the driver has to deal with conflicting goals here. One goal as we’ve seen is keeping the register usage count as low as possible. Another goal is to hide as much latency from sampling textures as possible. Let me explain this quickly.

Hiding Latency

Accessing data from memory (from textures or buffers) can take a long time, but it can happen parallel to both Vector and Scalar ALU execution. As long as we don’t need to use the result of the memory load we can keep working on other instruction to give the memory subsystem enough time to fetch the data. The more computation we can put between issuing the load and using the results, the more likely we won’t have to wait for the load from memory. To achieve this the compiler attempts to issue the vector memory requests which will ultimately write to our VGPRs as early as possible. This means the VGPRs that will ultimately contain the data we read from memory are not available for use by other instructions until our memory access has completed. This will help hiding the latency of the memory request, but on the other hand it can increase register pressure in the shader, which can often lead to the shader requiring more registers. At this time there is no way controlling this behaviour directly.
The way we hinted the compiler to re-use certain registers was to wrap the layer blending inside a loop and use the loop semantic to ensure the compiler won’t unroll it. This is the result after this quick restructuring:

Register Usage After Restructuring
Register Usage for The Shaders Used After Restructuring

With this simple trick we managed to claim back 42 registers. Which meant double the wavefront occupancy for this shader. This change translated to an almost two-times speedup in rendering tiles.

Further Reading

For a quick introduction to profiling on the GPU, I recommend the following article:
https://mynameismjp.wordpress.com/2011/10/13/profiling-in-dx11-with-queries/

You can find more information about the GCN architecture here:
http://developer.amd.com/wordpress/media/2013/06/2620_final.pdf
http://www.amd.com/Documents/GCN_Architecture_whitepaper.pdf

If you’d like to see some practical examples on hiding latency and GCN ISA:
https://bartwronski.com/2014/03/27/gcn-two-ways-of-latency-hiding-and-wave-occupancy/

View the other blogs in the Warhammer Wednesday series here.

If you have questions, feel free to comment.

Tamas Rabel is lead graphics programmer at Creative Assembly, working on the Total War games. Links to third party sites, and references to third party trademarks, are provided for convenience and illustrative purposes only. Unless explicitly stated, AMD is not responsible for the contents of such links, and no third party endorsement of AMD or any of its products is implied.

The post Anatomy Of The Total War Engine: Part II appeared first on GPUOpen.


Anatomy Of The Total War Engine: Part III

$
0
0

It’s Wednesday, so we’re continuing with our series on Total War: Warhammer. Here’s Tamas Rabel again with some juicy details about how Creative Assembly brought Total War to DirectX® 12.

DirectX® 12

We knew it won’t be a trivial task so we started working on the DirectX 12 port quite early during development. Warhammer is still using the same architecture as Attila or Rome 2. Our device abstraction is just a very thin layer on top of the DirectX 11 interface. This meant that the DirectX 12 port basically sits on top of a DirectX 11 interface. We started out in this very naïve way, which then led to lots of valuable insight.

Barriers

Barriers are synchronization points. To understand them, we have to start from resources. Resources are buffers, textures, vertex and index buffers, constant buffers, basically blobs of memory which we can read and/or write. They can live on the GPU or on CPU, or even in memory shared by both. They also come in read-only and write-only flavours.

So far this is quite intuitive. In DirectX 11 you specify the usage which pretty much determines these factors. Then you forget about all this and assume if you got the usage right, your job is done. In reality the resources have a much more dynamic life in the background. They constantly move through different logical states depending on how they are used by the application. Before DirectX 12 all of this was hidden by the drivers, but with DirectX 12, it’s the application’s responsibility to manage the state of resources. Which means every change in the internal state of a resource is marked by a Barrier. Barriers are the synchronization primitives making sure a resource doesn’t change state before finishing all the work related to its current state.

If you start reading about moving to DirectX 12 one of the first things that everyone mentions are barriers and that’s not a coincidence. While exposing barriers to the application developer does have the potential to make your game run faster compared with DirectX 11 they will make your game run much slower if not done right. The reason for that is during the last years, drivers got pretty good in figuring out different use-cases from the applications’ resource usage patterns.

Let’s take a look at a few examples of the most common causes for state changes and barriers in the Total War engine.

Total War games are well known for their scale of action. In a large battle there can be as many as thousands of units on the screen. This means thousands of unique instances, which means thousands of matrix stacks for skinning to upload. On DirectX 11, the code was simple: create some buffers with D3D11_USAGE_DYNAMIC and for each instance map/write data/unmap. Then the driver takes care of the rest.

Battle Scene Large Number Of Units

This is further complicated by the fact, that we have no upper limit on the number of units in the game. If we run out of instant buffer state, we flush the current batch of primitives, reset the instance buffers and trackers and keep accumulating instances.

In our very first DirectX 12 implementation we tried to mimic this behavior. For each dynamic resource we had we created a second buffer on the upload heap. On map/unmap we used the upload buffer and then we triggered the upload before the draw call. The idea was to keep the data in fast GPU memory and only update it when needed. This approach had two problems:

  • If we start transferring the resources from CPU to GPU just before the draw call, it’s already too late. The GPU has nothing else to hide this latency and we end up with bubbles in the pipeline. Our first attempt to remedy this was to start the transfer using the copy queue as soon as we finished preparing the instances. Unfortunately, as mentioned before we sometimes need to split batches and flush mid-processing, which breaks this method. We also found that it’s not even a good solution when all the data fits into the buffers. This is because although the copy queue does run nicely in the background, it can take a really long to spin up. For intra-frame purposes we always ended up copying on the queue which would use the data. And this leads to the second problem:
  • Too many barriers to transfer data between the CPU and the GPU and then draw, we first transitioned the GPU resource to the D3D12_RESOURCE_STATE_COPY_DEST , called CopyTextureRegion , then transitioned it back to D3D12_RESOURCE_STATE_GENERIC_READ , then called Draw. Apart from the fact that you should never use the GENERIC_READ state, this generated two barriers for every single draw call. That’s way too many. You should aim for roughly double the number of your render targets, plus maybe a handful of extras if you’re doing lots of compute.

The solution to these problems was just to read the upload heap directly from the GPU. Then we treat the whole upload heap just as a NOOVERWRITE resource and create custom views on the upload heap for the draw calls. This way we managed to get rid of the majority of our barriers and we traded the upload latency to slightly slower access speed, which is a much more optimal solution for our use case. It’s worth noting that for our use case we’re only accessing each byte of the resources we place in the upload heap exactly once. However, it’s worth considering a copy if you access the same resource many times.

If you have any questions, please feel free to comment or get in touch with Tamas on Twitter. Next time we’ll take a look at how we brought Asynchronous Compute to the Total War engine.

View the other blog posts in the Warhammer Wednesday series here.

Tamas Rabel is lead graphics programmer at Creative Assembly, working on the Total War games. Links to third party sites, and references to third party trademarks, are provided for convenience and illustrative purposes only. Unless explicitly stated, AMD is not responsible for the contents of such links, and no third party endorsement of AMD or any of its products is implied.

The post Anatomy Of The Total War Engine: Part III appeared first on GPUOpen.

AMD GCN Assembly: Cross-Lane Operations

$
0
0

Cross-lane operations are an efficient way to share data between wavefront lanes. This article covers in detail the cross-lane features that GCN3 offers.  I’d like to thank Ilya Perminov of Luxsoft for co-authoring this blog post.

Terminology

We’ll be optimizing communication between work-items, so it is important to start with a consistent set of terminology:

  • The basic execution unit of an AMD GCN GPU is called a wavefront, which is basically a SIMD vector.
  • A wavefront comprises 64 parallel elements, called lanes, that each represent a separate work item.
  • A lane index is a coordinate of the work item in a wavefront, with a value ranging from 0 to 63.
  • Because a wavefront is the lowest level that flow control can affect, groups of 64 work items execute in lockstep. The actual GCN hardware implements 16-wide SIMD, so wavefronts decompose into groups of 16 lanes called wavefront rows that are executed on 4 consecutive cycles.

This hardware organization affects cross-lane operations – some operations work at the wavefront level and some only at the row level. We’ll discuss the details below.

Why Not Just Use LDS?

Local data share (LDS) was introduced exactly for that reason: to allow efficient communication and data sharing between threads in the same compute unit. LDS is a low-latency RAM physically located on chip in each compute unit (CU). Still, most actual compute instructions operate on data in registers. Now, let’s look at the peak-performance numbers. The memory bandwidth of AMD’s Radeon R9 Fury X is an amazing 512 GB/s. Its LDS implementation has a total memory bandwidth of (1,050 GHz) * (64 CUs) * (32 LDS banks) * (4 bytes per read per lane) = 8.6 TB/s. Just imagine reading all the content of a high-capacity 8 TB HDD in one second! Moreover, the LDS latency is an order of magnitude less than that of global memory, helping feed all 4,096 insatiable ALUs. LDS is only available on a workgroup level.

At the same time, the register bandwidth is (1,050 GHz) * (64 CUs) * (64 lanes) * (12 bytes per lane) = 51.6 TB/s. That’s another order of magnitude, so communication between threads is much slower than just crunching data in the thread registers.

But can we do better by sharing? The answer is yes, if we further reduce our scope from a workgroup to a single wavefront.

DS-Permute Instructions

As a previous post briefly described, GCN3 includes two new instructions: ds_permute_b32 and ds_bpermute_b32 . They use LDS hardware to route data between the 64 lanes of a wavefront, but they don’t actually write to an LDS location. These instructions don’t require pairing; they simply provide a different way to express the lane addressing. The ds_permute_b32 instruction implements forward permute (“push” semantics), or simply “put my data in lane i,” and ds_bpermute_b32 (note the letter ‘b’ before permute ) implements backward permute (“pull” semantics), or “read data from lane i.” They have the following syntax:


ds_permute_b32 dest, addr, src [offset:addr_offset] // push to dest
ds_bpermute_b32 dest, addr, src [offset:addr_offset] // pull from src

// Examples:
ds_permute_b32 v0, v1, v2
ds_bpermute_b32 v0, v0, v1 offset:0x10

where dest, addr and src are VGPRs (vector general purpose registers) and addr_offset is an optional immediate offset. Both instructions take data from src , shuffle it on the basis of the provided address ( addr + addr_offset ) and save it to the dest register. The whole process divides into two logical steps:

  • All active lanes write data to a temporary buffer.
  • All active lanes read data from the temporary buffer, with uninitialized locations considered to be zero valued.

Addressing in Permute Instructions

The permute instructions move data between lanes but still use the notion of byte addressing, as do other LDS instructions. Hence, the value in the addr VGPR should be desired_lane_id * 4 , since VGPR values are 4 bytes wide.

The instructions add the addr_offset immediate to the addr value before accessing the temporary buffer, and this immediate can be used to rotate src values. Note that the instructions require a byte address, but they only move fully aligned doublewords. To put it another way, they only use bits [7:2] of the final address.

In many cases, the permute address is based on a work-item ID or lane ID. The work-item ID is loaded into v0 (and possibly v1 and v2 for multidimensional groups) before kernel execution. If you need the lane ID, try the following code, which fills VGPR v6 with that ID:


v_mbcnt_lo_u32_b32 v6, -1, 0
v_mbcnt_hi_u32_b32 v6, -1, v6

Backward-Permute Example

Consider the following ds_bpermute_b32 example with a simplified eight-lane wavefront; the VGPRs appear in yellow, the temporary buffer ( tmp ) in pink and inactive lanes in gray.

Backward-Permute-Example

In the first step, all lanes write data from src to corresponding locations in tmp . In the second step, they all read data from the tmp buffer on the basis of the address in addr . The index number shows the actual index of the tmp element from the second step. As the figure above illustrates, addr values in lanes 0 and 1 are different. Both values point to the same tmp element, however, because the two least-significant address bits are ignored. Similarly, address 272 in lane 7 wraps around and points to element 4 in the src register.

The right side of the figure shows an example using the same argument values but with the EXEC mask disabling lanes 2 and 3. As a result, the instruction won’t overwrite the dest elements corresponding to those lanes. Moreover, some lanes read from uninitialized tmp elements and thus receive a zero value.

Forward-Permute Example

Now consider a ds_permute_b32 example using the same arguments as before:

Forward-Permute-Example

All lanes write src data to the tmp buffer on the basis of the addresses in the addr register, followed by a direct read in the second step. Everything else here is the similar to the first example, with one exception: some lanes can write to the same tmp element (consider lanes 0 and 1 in the figure above). Such a situation is impossible in the case of ds_bpermute_b32 . This conflict is resolved in the same way as writing to the same LDS address: the lane with the greater ID wins.

The Swizzle Instruction

The ds_swizzle_b32 instruction allows lanes to exchange their data in some limited ways. The advantage relative to permute instructions is that ds_swizzle_b32 requires no additional VGPR—the swizzle pattern is encoded in the instruction’s offset field. Moreover, this feature will most likely save a few address generation instructions required for ds_permute . The swizzle instruction has the following syntax:


ds_swizzle_b32 dest, src offset:ds_pattern
// Examples:
ds_swizzle_b32 v5, v2 offset:0x80F6

A ds_swizzle_b32 implements “pull” semantics: each lane reads some element of src . The EXEC mask functions in the same way as in the case of the permute instructions. The 15th bit of ds_pattern controls which of the two modes will be used:

  • Quad-permute mode (QDMode). Each of the four adjacent lanes can access each other’s data, and the same switch applies to each set of four. The ds_pattern LSBs directly encode the element ID for each lane.
  • Bit-masks mode (BitMode). This mode enables limited data sharing within 32 consecutive lanes. Each lane applies bitwise logical operations with constants to its lane ID to produce the element ID from which to read. Constants are encoded in ds_pattern .

The diagram below shows the ds_pattern layout for each mode:

ds_pattern layout for each mode

Consider the formal ds_pattern description:


// QDMode - full data sharing in 4 consecutive threads
if (offset[15]) {
     for (i = 0; i < 32; i+=4) {
          thread_out[i+0] = thread_valid[i+offset[1:0]] ? thread_in[i+offset[1:0]] : 0;
          thread_out[i+1] = thread_valid[i+offset[3:2]] ? thread_in[i+offset[3:2]] : 0;
          thread_out[i+2] = thread_valid[i+offset[5:4]] ? thread_in[i+offset[5:4]] : 0;
          thread_out[i+3] = thread_valid[i+offset[7:6]] ? thread_in[i+offset[7:6]] : 0;
     }
}

// BitMode - limited data sharing in 32 consecutive threads
else {
     and_mask = offset[4:0];
     or_mask = offset[9:5];
     xor_mask = offset[14:10];
     for (i = 0; i < 32; i++)
     {
         j = ((i & and_mask) | or_mask) ^ xor_mask;
         thread_out[i] = thread_valid[j] ? thread_in[j] : 0;
     }
}
// Same shuffle applied to the second half of wavefront

QDMode is clear, as the following example illustrates:

QDMode
QDMode

ds-swizzle-b32

On the other hand, BitMode looks more complicated; and_mask , or_mask and xor_mask apply sequentially to the lane index, as the code above shows. By setting these masks, you can choose one of the operations applied to each bit of the lane index: set to 0, set to 1, preserve or inverse. Some of the interesting patterns are the following:

Swap the neighboring groups of 1, 2, 4, 8 or 16 lanes ( and_mask = 0x1F , or_mask = 0x0 and only one bit is set in xor_mask ):

swap

Mirror/reverse the lanes for groups of 2, 4, 8, 16 or 32 lanes ( and_mask = 0x1F, or_mask = 0x0 and the LSBs of xor_mask are set to 1):

mirror_reverse

Broadcast the value of any particular lane for groups of 2, 4, 8, 16 or 32 lanes ( and_mask MSBs are 1 and LSBs are 0, or_mask is the lane index for a group, and xor_mask = 0x0 ):

broadcast

Other Notes on DS Cross-Lane Instructions

The permute and swizzle instructions employ LDS hardware. Thus, you must use s_waitcnt to determine when data is returned to the destination VGPR. Such an approach, however, has many advantages compared with manually passing data using LDS memory:

  • The permute and swizzle instructions don’t access LDS memory and may be called even if the wavefront has no allocated LDS memory.
  • The approach requires only one instruction, not ds_write* and ds_read* , so it executes faster and saves space in the instruction cache.
  • It avoids LDS-bank conflicts for an arbitrary shuffle, so instructions have low latency.

Data-Parallel Primitives (DPP)

Now it’s time to talk about something really cool! The DPP feature doesn’t employ new instructions; rather, it introduces the new VOP_DPP modifier, which allows VALU instructions to access data in neighboring lanes. Spending additional instruction to move data (even with the swizzle and permutes) is unnecessary—now, most of the vector instructions can do cross-lane reading at full throughput.

Of course, there’s no magic, so this feature only supports limited data sharing. DPP was developed with scan operations in mind, so it enables the following patterns (the corresponding DPP keywords appear in brackets):

  • Full crossbar in a group of four ( quad_perm )
  • Wavefront shift left by one lane ( wave_shl )
  • Wavefront shift right by one lane ( wave_shr )
  •  Wavefront rotate right by one lane ( wave_ror )
  •  Wavefront rotate left by one lane ( wave_rol )
  • Row shift left by 1–15 lanes ( row_shl )
  • Row shift right by 1–15 lanes ( row_shr )
  • Row rotate right by 1–15 lanes ( row_ror )
  • Reverse within a row ( row_mirror )
  • Reverse within a half-row ( row_half_mirror )
  • Broadcast the 15th lane of each row to the next row ( row_bcast )
  • Broadcast lane 31 to rows 2 and 3 ( row_bcast )

Here, the term row means one-quarter of a wavefront (more on this subject later). The VOP_DPP modifier can work with any VOP1 or VOP2 instruction encoding (the VOP3 and VOPC encodings are unsupported), except the following:

  • v_clrexcp
  • v_readfirstlane_b32
  • v_madmk_{ f16,f32}
  • v_madak_{ f16,f32}
  • v_movrel*_b32
  • Instructions with 64-bit operands

The DPP modifier is encoded as a special 32-bit literal (search for VOP_DPP in the GCN ISA guide), and this modifier always applies to the src0 instruction operand. The following example shows how to apply DPP to a particular instruction:


v_and_b32 dest, src0, src1 wave_shr:1

how-to-apply-DPP

DPP Bound Control and Masking

As the example above shows, lane 0 should read from an invalid location (lane –1); hence, it fails to update its corresponding element in the dest register. Alternatively, by setting the DPP-flag bound_ctrl:0 user can read 0 instead of disabling a lane (note that this is legacy notation; the bound_ctrl:0 flag will set the BOUND_CTRL field of VOP_DPP to 1). Lanes disabled by the EXEC mask are also invalid locations from which to read values.

The lanes of a wavefront are organized in four banks and four rows, as the table below illustrates:

Lanes of a Wavefront

By setting row_mask and bank_mask , you can disable any bank or row in addition to the EXEC mask, which is helpful for scan operations. As a quick summary:

  • Lanes disabled by the EXEC mask or DPP mask will not update the dest register.
  • Lanes that try to access invalid locations or data from lanes disabled by the EXEC mask
    • will not update the dest register if BOUND_CTRL=0 (default).
    • will read 0 as an src0 input if BOUND_CTRL=1 (DPP flag bound_ctrl:0 ).

DPP Example

Consider the following example, which computes a full prefix sum in a wavefront:


v_add_f32 v1, v0, v0 row_shr:1 bound_ctrl:0 // Instruction 1
v_add_f32 v1, v0, v1 row_shr:2 bound_ctrl:0 // Instruction 2
v_add_f32 v1, v0, v1 row_shr:3 bound_ctrl:0 // Instruction 3
v_nop // Add two independent instructions to avoid a data hazard
v_nop
v_add_f32 v1, v1, v1 row_shr:4 bank_mask:0xe // Instruction 4
v_nop // Add two independent instructions to avoid a data hazard
v_nop
v_add_f32 v1, v1, v1 row_shr:8 bank_mask:0xc // Instruction 5
v_nop // Add two independent instructions to avoid a data hazard
v_nop
v_add_f32 v1, v1, v1 row_bcast:15 row_mask:0xa // Instruction 6
v_nop // Add two independent instructions to avoid a data hazard
v_nop
v_add_f32 v1, v1, v1 row_bcast:31 row_mask:0xc // Instruction 7

The full code is available at GitHub (see dpp_reduce in examples/gfx8 ). Here, source data resides in v0 and the computed prefix sum in v1 . The following image shows data transfers for the above code:

dpp-data-transfers

Lanes containing the final result appear in green, and lanes disabled by the DPP mask are in gray. The DPP masks from instructions 4 and 5 in the code above are optional and leave the result unaffected, because disabled lanes are effectively reading from invalid locations anyway. But the row_mask parameter is necessary for instructions 6 and 7; otherwise, instruction 6 will corrupt values for lanes [0:15] and [32:47] and instruction 7 will corrupt values for lanes [0:31].

Other Notes on DPP Usage

The hardware resolves most data dependencies, but the software must handle a few cases explicitly to prevent data hazards. The full list of such cases is in the “Manually Inserted Wait States” section of the GCN ISA guide. For example, a sequence in which a VALU instruction updates an SGPR and a VMEM operation subsequently reads that SGPR is illegal. At least five so-called wait states must sit between these two operations. A wait state is a NOP or any other independent instruction.

Although DPP instructions execute at the full rate, they introduce new data-hazard sources that should be handled in software:

  • If a previous VALU instruction modifies a VGPR read by DPP, two wait states are required. Note that this hazard affects only the operand that DPP reads. Consider instructions 2 and 3 in the example above; they consume the output from the previous VALU instruction by reading v1 . But DPP applies to v0 , and because v0 is unmodified, wait states are unnecessary.
  • If a previous VALU instruction writes an EXEC mask, five wait states are required. This hazard is unlikely to become a problem because it’s triggered only by VALU instructions that write an EXEC mask (any v_cmpx_* , such as v_cmpx_ge_i32 ), and because scalar instructions are unaffected.

The DPP literal also has negative- and absolute-input modifiers, so such operations on float input values are free:


v_add_f32 v0, -v1, |v2| wave_shr:1
v_add_f32 v0, -|v1|, v2 wave_shr:1

Compiler and Tool Support

These new instructions can be accessed from HCC compiler or from the GCN assembler:

  • AMD’s HCC compiler provides intrinsic function support for ds_permute, ds_bpermute, and ds_swizzle. These are device functions (marked with [[hc]]) and thus can be called from HC or HIP kernels (running on hcc):
    • extern "C" int __amdgcn_ds_bpermute(int index, int src) [[hc]];
    • extern "C" int __amdgcn_ds_permute(int index, int src) [[hc]];
    • extern "C" int __amdgcn_ds_swizzle(int src, int pattern) [[hc]];
  • Additionally, DPP is exposed as a special move instruction. The compiler will combine the DPP move with the subsequent instructions, if possible:
  • extern "C" int __amdgcn_move_dpp(int src, int dpp_ctrl, int row_mask, int bank_mask, bool bound_ctrl) [[hc]];

When using these instrinsics, HCC will automatically ensure that the proper .waitcnt and data dependencies are honored.

  • AMD also provides an open-source GCN assembler, integrated into the popular LLVM compiler. The GCN assembler includes support for all of the operations described here today, as well as full examples showing use of the instructions.


Summary

The table below provides notes summarizing our description of the DPP modifier and LDS-based instructions that provide cross-lane data-sharing capabilities.

ds_permute_b32/ ds_bpermute_b32 ds_swizzle_b32 DPP Modifier
Description Instructions that permute lane data on the basis of an address in the VGPR Instruction that permutes lane data on the basis of a pattern encoded in the instruction’s offset field Modifier that allows VOP1 / VOP2 instructions to take an argument from another lane
Available Cross-Lane Patterns Any
  • Full crossbar in a group of four
  • Limited sharing in a group of 32, such as the following:
    • Swap groups of 1, 2, 4, 8 or 16
    • Reverse in groups of 2, 4, 8, 16 or 32
    • Broadcast any lane in a group of 2, 4, 8, 16 or 32
    • Any other shuffle that can be expressed using bit masks
  • Full crossbar in a group of four
  • Wavefront shift/rotate by one lane
  • Row shift/rotate by 1–15 lanes
  • Reverse inside a row or half-row
  • Broadcast 15th lane of each row to the next row
  • Broadcast lane 31 to rows 2 and 3
Performance Considerations
  • Requires s_waitcnt , but offers low latency
  • Requires additional VGPR to provide address
  • Potentially necessitating additional instructions to read or generate address
  • Requires s_waitcnt , but offers low latency
  • Operates at full instruction rate
  • Requires two wait states if the previous VALU instruction modifies the input VGPR that shares the data
  • Requires five wait states if the previous VALU instruction modifies the EXEC mask
  • Appends additional doubleword (32 bits) to the instruction stream

References

GCN3 ISA guide
GitHub code with ASM examples

Ilya Perminov is a software engineer at Luxoft. He earned his PhD in computer graphics in 2014 from ITMO University in Saint Petersburg, Russia. Ilya interned at AMD in 2015, during which time he worked on graphics-workload tracing and performance modeling. His research interests include real-time rendering techniques, GPU architecture and GPGPU.

Ben Sander is a Senior Fellow at AMD and the lead software architect for the ROCm (aka Boltzmann) and HSA projects. He has held a variety of management and leadership roles during his career at AMD including positions in CPU micro-architecture, performance modeling, and GPU software development and optimization. Links to third party sites are provided for convenience and unless explicitly stated, AMD is not responsible for the contents of such linked sites and no endorsement is implied.

The post AMD GCN Assembly: Cross-Lane Operations appeared first on GPUOpen.

Leveraging asynchronous queues for concurrent execution

$
0
0

Understanding concurrency (and what breaks it) is extremely important when optimizing for modern GPUs. Modern APIs like DirectX® 12 or Vulkan™ provide the ability to schedule tasks asynchronously, which can enable higher GPU utilization with relatively little effort.

Why concurrency is important

Rendering is an embarrassingly parallel task. All triangles in a mesh can get transformed in parallel and non-overlapping triangles can get rasterized in parallel. Consequentially GPUs are designed to do a lot of work in parallel. E.g. Radeon™ Fury X GPU consists of 64 Compute Units (CUs), each of those containing 4 Single-Instruction-Multiple-Data units (SIMD) and each SIMD executes blocks of 64 threads, which we call a “wavefront”. Since latency for memory access can cause significant stalls in shader execution, up to 10 wavefronts can be scheduled on each SIMD simultaneously to hide this latency.

There are several reasons why the actual number of wavefronts in flight is often lower than this theoretical maximum. The most common reasons for this are:

  • A Shader uses many Vector General Purpose Registers (VGPR): E.g. if a shader uses more than 128 VGPR only one wavefront can get scheduled per SIMD (for details on why, and how to compute how many wavefronts a shader can run, please see the article on how to use CodeXL to optimize GPR usage).
  • LDS requirements: if a shader uses 32KiB of LDS and 64 threads per thread group, this means only 2 wavefronts can be scheduled simultaneously per CU.
  • If a compute shader doesn’t spawn enough wavefronts, or if lots of low geometry draw calls only cover very few pixels on screen, there may not be enough work scheduled to create enough wavefronts to saturate all CUs.
  • Every frame contains sync points and barriers to ensure correct rendering, which cause the GPU to become idle.

Asynchronous compute can be used to tap into those GPU resources that would otherwise be left on the table.

The two images below are screenshots vizualizing what is happening on one shader engine of a Radeon™ RX480 GPU in typical parts of a frame. The graphs are generated by a tool we use internally at AMD to identify optimization potential in games.
The upper sections of the images show the utilization of the different parts of one CU. The lower sections show how many wavefronts of different shader types are launched.

The first image shows ~0.25ms of G-Buffer rendering. In the upper part the GPU looks pretty busy, especially the export unit. However it is important to note that none of the components within the CU are completely saturated.

gbuffertt

The second image shows 0.5ms of depth-only rendering. In the left half no PS is used, which results in very low CU utilization. Near the middle some PS waves get spawned, probably due to rendering transparent geometry via alpha testing (but the reason is not visible in those graphs). In the rightmost quarter there are a few sections where the total number of waves spawned drops to 0. This could be due to render targets getting used as textures in the following draw calls, so the GPU has to wait for previous tasks to finish.

depthonlytt

Improved performance through higher GPU utilization

As can be seen in those images, there is a lot of spare GPU resources in a typical frame. The new APIs are designed to provide developers with more control over how tasks are scheduled on the GPU. One difference is that almost all calls are implicitly assumed to be independent and it’s up to the developer to specify barriers to ensure correctness, such as when a draw operation depends on the result of a previous one. By shuffling workloads to improve batching of barriers, applications can improve GPU utilization and reduce the GPU idle time spent in barriers each frame.

An additional way to improve GPU utilization is asynchronous compute: instead of running a compute shader sequentially with other workloads at some point in the frame, asynchronous compute allows execution simultaneously with other work. This can fill in some of the gaps visible in the graphs above and provide additional performance.

To allow developers to specify which workloads can be executed in parallel, the new APIs allow applications to define multiple queues to schedule a task onto.
There are 3 types of queues:

  • Copy Queue(DirectX 12) / Transfer Queue (Vulkan): DMA transfers of data over the PCIe bus
  • Compute queue (DirectX 12 and Vulkan): execute compute shaders or copy data, preferably within local memory
  • Direct Queue (DirectX 12) / Graphics Queue (Vulkan):  this queue can do anything, so it is similar to the main device in legacy APIs

The application can create multiple queues for simultaneous use: in DirectX 12 an arbitrary number of queues for each type can be created, while in Vulkan the driver will enumerate the number of queues supported.
GCN hardware contains a single geometry frontend, so no additional performance will be gained by creating multiple direct queues in DirectX 12. Any command lists scheduled to a direct queue will get serialized onto the same hardware queue. While GCN hardware supports multiple compute engines we haven’t seen significant performance benefits from using more than one compute queue in applications profiled so far. It is generally good practice not to create more queues than what the hardware supports in order to have more direct control on command list execution.

Build a task graph based engine

How to decide which work to schedule asynchronously? A frame should be considered a graph of tasks, where each task has some dependencies on other tasks. For example, multiple shadow maps can be generated independently, and this may include a processing phase with a compute shader generating Variance Shadow Map (VSM) using shadow map inputs. A tiled lighting shader, processing all shadowed light sources simultaneously, can only start after all shadow maps and the G-Buffer have finished processing. In this case VSM generation could run while other shadow maps get rendered, or batched during G-Buffer rendering.
Similarly generating ambient occlusion depends on the depth buffer, but is independent of shadows or tiled lighting, so it’s usually a good candidate for running on the asynchronous compute queue.

In our experience of helping game developers come up with optimal scenarios to take advantage of asynchronous compute we found that manually specifying the tasks to run in parallel is more efficient than trying to automate this process. Since only compute tasks get scheduled asynchronously, we recommend to implement a compute path for as many render workloads as possible in order to have more freedom in determining which tasks to overlap in execution.
Finally, when moving work to the compute queue, the application should make sure each command list is big enough. This will allow performance gains from asynchronous compute to make up for the cost of splitting the command list and stalling on fences, which are required operations for synchronizing tasks on different queues.

How to check if queues are working as expected

I recommend using GPUView to ensure asynchronous queues in an application are working as expected. GPUView will visualize which queues are used, how much work each queue contains and, most importantly, if the workloads are actually executed in parallel to each other.

Under Windows® 10 most applications will at least show one 3D graphics queue and a copy queue, which is used by Windows for paging. In the following image you can see one frame of an application using an additional copy queue for uploading data to the GPU. The grab is from a game in development using a copy queue to stream data and upload dynamic constant buffers before the frame starts rendering. In this build of the game the graphics queue needed to wait for the copy to finish, before it could start rendering. In the grab it can also be seen, that the copy queue waits for the previous frame to finish rendering before the copy starts:

synccopy

In this case, using the copy queue did not result in any performance advantage, since no double buffering on the uploaded data was implemented. After the data got double-buffered, the upload now happens while the previous frame is still being processed by the 3D queue and the gap in the 3D queue is eliminated. This change saved almost 10% of the total frame time.

The second example shows two frames of the benchmark scene in Ashes of the Singularity, a game, which makes heavy use of the compute queue:

asynccompute

The asynchronous compute queue is used for most of the frame. It can be seen from the trace that the graphics queue is not stalled while waiting on the compute queue, which is a good starting point to ensure asynchronous compute is best placed to provide performance gains.

What could possibly go wrong?

When using asynchronous compute it needs to be taken into account that even though the command lists on different queues are executed in parallel, they still share the same GPU resources.

  • If resources are located in system memory accessing those from Graphics or Compute queues will have an impact on DMA queue performance and vice versa.
  • Graphics and Compute queues accessing local memory (e.g. fetching texture data, writing to UAVs or performing rasterization-heavy tasks) can affect each other due to bandwidth limitations
  • Threads sharing the same CU will share GPRs and LDS, so tasks that use all available resources may prevent asynchronous workloads to execute on the same CU
  • Different queues share their caches. If multiple queues utilize the same caches this can result in more cache thrashing and reduce performance

Due to the reasons above it is recommended to determine bottlenecks for each pass and place passes with complementary bottlenecks next to each other:

  • Compute shaders which make heavy use of LDS and ALU are usually good candidates for the asynchronous compute queue
  • Depth only rendering passes are usually good candidates to have some compute tasks run next to it
  • A common solution for efficient asynchronous compute usage can be to overlap the post processing of frame N with shadow map rendering of frame N+1
  • Porting as much of the frame to compute will result in more flexibility when experimenting which tasks can be scheduled next to each other
  • Splitting tasks into sub-tasks and interleaving them can reduce barriers and create opportunities for efficient async compute usage (e.g. instead of “for each light clear shadow map, render shadow, compute VSM” do “clear all shadow maps, render all shadow maps, compute VSM for all shadow maps”)

It is important to note that asynchronous compute can reduce performance when not used optimally. To avoid this case it is recommended to make sure asynchronous compute usage can easily be enabled or disabled for each task. This will allow you to measure any performance benefit and ensure your application runs optimally on a wide range of hardware.

Stephan Hodes is a member of the Developer Technology Group at AMD. Links to third party sites are provided for convenience and unless explicitly stated, AMD is not responsible for the contents of such linked sites and no endorsement is implied.

The post Leveraging asynchronous queues for concurrent execution appeared first on GPUOpen.

Capsaicin and Cream developer talks at GDC 2017

$
0
0

Introduction

Shortly after our Capsaicin and Cream event at GDC this year where we unveiled Radeon RX Vega, we hosted a developer-focused event designed to bring together the tight-knit community of graphics programmers attending GDC. The focus of the event was knowledge sharing and discussion on the future of real-time graphics, preceded by a handful of great presentations from invited friends to get everyone in the mood.
Twenty minutes each — spanning topics as diverse as the future of texture compression, a new scriptable renderer in Unity, and optimised VR rendering — each of the five presentations is packed with information well worth absorbing.
And not only did we record the sessions, but we also have the slide decks for you to follow along with and refer back to. So if you’re looking for something relevant and bite-sized to keep you interested while you wait for that pesky full build, there’s something here for you.

Presentations

Arne Schober, Epic – Slides

First up we had Arne Schober at Epic to give us a rundown of a number of recent interesting improvements to UE4’s renderers, from MSAA support in the forward renderer for VR, to compositing a usable UI on top of a HDR image.

Aras Pranckevicius – Slides

Aras Pranckevicius, Unity Code Plumber, was up after Arne. Aras told the assembled audience about a new rendering system being developed out in the open for Unity 5. With a tightly controlled and highly-efficient C++ core unpinning a scriptable surface area in C#, it’s one of biggest graphics focused changes to Unity in its history. Designed to drive the GPU more efficiently, it’s already available to try out in beta versions of Unity today. Watch Aras’ talk and then maybe give it a whirl.

Stephanie Hurlburt – Slides

Next up was Stephanie Hurlburt, co-founder of Binomial. Binomial are the creators of Basis, a very exciting new take on multi-platform texture compression that has wide applicability, and not just to games. Stephanie’s talk was a great primer on Basis and the problems it’s designed and engineered to solve.

Tamas Rabel – Slides

Stephanie was followed by Tamas Rabel, Lead Graphics Programmer at Creative Assembly. Tamas took his 20 minutes to let us know how Creative Assembly have evolved their engine, which originally targeted DirectX® 9, to abstract over the disparate graphics APIs they need to support for Warhammer now, including DirectX 12.

Dan Baker – Slides

Last but not least was Oxide’s Dan Baker. What better way to do R&D into a new direction you’d like to take your engine than create a small game for it? That’s exactly what Oxide have done by creating Not Enough Bullets, a test case for the next generation of their latest engine, Nitrous, and its future forays into VR. Dan talked about working out how to make the very best use of multi-core CPUs and the GPU to reduce motion-to-photon latency, using Not Enough Bullets to drive things forwards.

Rys Sommefeldt looks after the Game Engineering group in Europe, which is part of the Radeon Technologies Group at AMD. Links to third party sites are provided for convenience and unless explicitly stated, AMD is not responsible for the contents of such linked sites and no endorsement is implied.

The post Capsaicin and Cream developer talks at GDC 2017 appeared first on GPUOpen.

Optimizing GPU occupancy and resource usage with large thread groups

$
0
0

Intro

This week, we’ve got a guest posting from Sebastian Aaltonen, co-founder of Second Order LTD and previously senior rendering lead at Ubisoft®. Second Order have recently announced their first game, Claybook! Alongside the game looking like really great fun, its renderer is novel, using the GPU in very non-traditional ways in order to achieve its look. Check out Claybook!

Sebastian is going to cover an interesting problem he faced while working on Claybook: how you can optimize GPU occupancy and resource usage of compute shaders that use large thread groups.

Occupancy and Resource Usage Optimization with Large Thread Groups

When using a compute shader, it is important to consider the impact of thread group size on performance. Limited register space, memory latency and SIMD occupancy each affect shader performance in different ways. This article discusses potential performance issues, and techniques and optimizations that can dramatically increase performance if correctly applied. This article will be focusing on the problem set of large thread groups, but these tips and tricks are helpful in the common case as well.

Background

The DirectX® 11 Shader Model 5 compute shader specification (2009) mandates a maximum allowable memory size per thread group of 32 KiB, and a maximum workgroup size of 1024 threads. There is no specified maximum register count, and the compiler can spill registers to memory if necessitated by register pressure. However, due to memory latency, spilling entails a significant negative performance impact and should be avoided in production code.

Modern AMD GPUs are able to execute two groups of 1024 threads simultaneously on a single compute unit (CU). However, in order to maximize occupancy, shaders must minimize register and LDS usage so that resources required by all threads will fit within the CU.

AMD GCN compute unit (CU)

Consider the architecture of a GCN compute unit:

A GCN CU includes four SIMDs, each with a 64 KiB register file of 32-bit VGPRs (Vector General-Purpose Registers), for a total of 65,536 VGPRs per CU. Every CU also has a register file of 32-bit SGPRs (scalar general-purpose registers). Until GCN3, each CU contained 512 SGPRs, and from GCN3 on the count was bumped to 800. That yields 3200 SGPRs total per CU, or 12.5 KiB.

The smallest unit of scheduled work for the CU to run is called a wave, and each wave contains 64 threads. Each of the four SIMDs in the CU can schedule up to 10 concurrent waves. The CU may suspend a wave, and execute another wave, while waiting for memory operations to complete. This helps to hide latency and maximize use of the CU’s compute resources.

The size of the SIMD VGPR files introduce an important limit: VGPRs of the SIMD are evenly divided between threads of the active waves. If a shader requires more VGPRs than are available, the SIMD will not be able to execute the optimal number of waves. Occupancy, a measure of the parallel work that the GPU could perform at a given time, will suffer as a result.

Each GCN CU has 64 KiB Local Data Share (LDS). LDS is used to store the groupshared data of compute shader thread groups. Direct3D limits the amount of groupshared data a single thread group can use to 32 KiB. Thus we need to run at least two groups on each CU to fully utilize the LDS.

Large thread group resource goals

My example shader in this article is a complex GPGPU physics solver with thread group size of 1024. This shader uses maximum group size and maximum amount of groupshared memory. It benefits from a large group size, because it solves physics constraints using groupshared memory as temporal storage between multiple passes. Bigger thread group size means that bigger islands can be processed without the need of writing temporary results to global memory.

Now, let’s discuss about the resource goals we must meet to run groups of 1024 threads efficiently:

  • Registers: To saturate the GPU, each CU must be assigned two groups of 1024 threads. Given 65,536 available VGPRs for the entire CU, each thread may require, at maximum, 32 VGPRs at any one time.
  • Groupshared memory: GCN has 64 KiB of LDS. We can use the full 32 KiB of groupshared memory and still fit two groups per CU.

If the shader exceeds these limits, there will not enough resources on the CU to run two groups at the same time. The 32 VGPR goal is difficult to reach. We will be first discussing the problems you face if you don’t reach this goal, and then solutions to solve this problem and finally how to avoid it altogether.

Problem: Single thread group per CU

Consider the case where an application uses the maximum group size of 1024 threads, but the shader requires 40 VGPRs. In this case, only one thread group per CU may execute at a time. Running two groups, or 2048 threads, would require 81,920 VGPRs – far more than the 65,536 VGPRs available on the CU.

1024 threads will yield 16 waves of 64 threads, which are distributed equally among the SIMDs resulting in 4 waves per SIMD. We learned earlier that optimal occupancy and latency hiding requires 10 waves, so 4 waves results in a mere 40% occupancy. This significantly reduces the latency hiding potential of the GPU, resulting in reduced SIMD utilization.

Let’s assume your group of 1024 threads is using the maximum of 32 KiB LDS. When only one group is running, 50% of LDS is not utilized as it is reserved for a second thread group, which is not present due to register pressure. Register file usage is 40 VGPRs per thread, for a total of 40,960 VGPRs, or 160 KiB. Thus, 96 KiB (37.5%) of each CU register file is wasted.

As you can see, maximum size thread groups can easily result in bad GPU resource utilization if only one group fits to a CU because we exceed our VGPR budget.

When evaluating potential group size configurations, it is important to consider the GPU resource lifecycle.

GPUs allocate and release all resources for a thread group simultaneously. Registers, LDS and wave slots must all be allocated before group execution can start, and when the last wave of the group finishes execution, all the group resources are freed. So if only one thread group fits on a CU, there will be no overlap in allocation and deallocation since each group must wait for the previous group to finish before it can start. Waves within a group will finish at different times, because memory latency is unpredictable. Occupancy decreases since waves in the next group cannot start until all waves in the previous group complete.

Large thread groups tend to use lots of LDS. LDS access is synchronized with barriers ( GroupMemoryBarrierWithGroupSync , link, in HLSL). Each barrier prevents execution from continuing until all other waves of the same group have reached that point. Ideally, the CU can execute another thread group while waiting on barriers.

Unfortunately, in our example, we only have one thread group running. When only one group is running on a CU, barriers limit all waves to the same limited set of shader instructions. The instruction mix is often monotonous between two barriers, and so all waves in a thread group will tend to load memory simultaneously. Because the barrier prevents moving on to later independent parts of the shader, there’s no opportunity for using the CU for useful ALU work that would hide the memory latency.

Solution: Two thread groups per CU

Having two thread groups per CU significantly reduces these problems. Both groups tend to finish at different times and hit different barriers at different times, improving the instruction mix and reducing the occupancy ramp down problem significantly. SIMDs are better utilized and there’s more opportunity for latency hiding.

I recently optimized a 1024 thread group shader. Originally it used 48 VGPRs, so only one group was running on each CU.  Reducing VGPR usage to 32 yielded a 50% performance boost on one platform, without any other optimizations.

Two groups per CU is the best case with maximum size thread groups. However, even with two groups, occupancy fluctuation is not completely eliminated. It is important to analyze the advantages and disadvantages before choosing to go with large thread groups.

When large thread groups should be used

The easiest way to solve a problem is to avoid it completely. Many of the issues I’ve mentioned can be solved by using smaller thread groups. If your shader does not require LDS, there is no need to use larger thread groups at all.

When LDS is not required, you should select a group size between 64 to 256 threads. AMD recommends a group size of 256 as the default choice, because it suits their work distribution algorithm best. Single wave, 64 threads, groups also have their uses: GPU can free resources as soon as the wave finishes and AMDs shader compiler can remove all memory barriers as the whole wave is guaranteed to proceed in lock step. Workloads with highly fluctuating loops, such as the sphere tracing algorithm used to render our Claybook game, benefit the most from single wave work groups.

However, LDS is a compelling, useful feature of compute shaders that is missing from other shader stages, and when used correctly it can provide huge performance improvements. Loading common data into LDS once – rather than having each thread perform a separate load – reduces redundant memory access. Efficient LDS usage may reduce L1 cache misses and thrashing, and commensurate memory latency and pipeline stalls.

The problems encountered with groups of 1024 threads are significantly reduced when the group size is reduced. Group size of 512 threads is already much better: Up to 5 groups fit at one to each CU. But you still need to adhere to the tight 32 VGPR limit to reach good occupancy.

Neighborhood processing

Many common post-processing filters (such as temporal antialiasing, blurring, dilation, and reconstruction) require knowledge of an element’s nearest neighbors.  These filters experience significant performance gains – upwards of 30% in some cases – by using LDS to eliminate redundant memory access.

If we assume a 2D input, and that each thread is responsible for shading a single pixel, we can see that each thread must retrieve its initial value as well as the eight adjacent pixels. Each neighboring pixel will also require the thread’s initial value. Additionally, the center value is required by each neighboring thread. This leads to many redundant loads. In the general case, each pixel will be required by nine different threads. Without LDS, that pixel must be loaded nine times – once for each thread that requires it.

By first loading the required data into LDS, and replacing all subsequent memory loads with LDS loads, we significantly reduce the number of accesses to global device memory and the potential for cache thrashing.

LDS is most effective when there is a significant amount of data that can be shared within the group. Larger neighborhoods – and, therefore, larger group sizes – result in more data that can be meaningfully shared, and further reduces redundant loads.

Let us assume a 1-pixel neighborhood and a square 2D thread group. The group should load all pixels inside the group area and a one-pixel border to satisfy boundary condition requirements. A square area with side length X requires X^2 interior pixels, and 4X+4 boundary pixels. The interior payload scales quadratically, while the boundary overhead – pixels which are read, but not written to – scales linearly.

An 8×8 group with a one-pixel border encompasses 64 interior pixels and 36 border pixels, for a total of 100 loads. This requires 56% overhead.

Now consider a 16×16 thread group. The payload contains 256 pixels, with an additional overhead of 68 border pixels.  Although the payload size is four times larger, the overhead is only 68 pixels, or 27%. By doubling the dimensions of the group, we have reduced overhead significantly. At the largest possible thread group size of 1024 threads – a square 32×32 neighborhood – the overhead of reading 132 border pixels accounts for a mere 13% of loads.

3D groups scale even better, since the group volume increases even faster than the boundary area. For a small 4x4x4 group, the payload contains 64 elements, while the surface boundary, an empty 6x6x6 cube, requires 216 elements, for an overhead of 70%. However, an 8x8x8 group with 512 interior pixels and a boundary area of 488 pixels requires 48% overhead. Neighbor overhead is huge for small thread group sizes, but improves with larger thread group sizes. Clearly, large thread groups have their uses.

Multi-passing with LDS

There are many algorithms that require multiple passes. Simple implementations store intermediate results in global memory, consuming significant memory bandwidth.

Sometimes each independent part, or “island,” of a problem is small, making it possible to split the problem into multiple steps or passes by storing intermediate results in LDS. A single compute shader performs all required steps and writes intermediate values to LDS between each step. Only the result is written to memory.

Physics solvers are a good application of this approach. Iterative techniques such as Gauss-Seidel require multiple steps to stabilize all constraints. The problem can be split into islands: all particles of a single connected body are assigned to the same thread group, and solved independently. Subsequent passes may deal with inter-body interactions, using the intermediate data calculated in the previous passes.

Optimize VGPR Usage

Shaders with large thread groups tend to be complex. Hitting the goal of 32 VGPRs is hard. Here are some tricks I have learned in the past years:

Scalar Data

GCN devices have both vector (SIMD) units, which maintain different state for each thread in a wave, and a scalar unit, which contains a single state common to all threads within a wave. For each SIMD wave, there is one additional scalar thread running, with its own SGPR file. The scalar registers contain a single value for the whole wave. Thus, SGPRs have 64x lower on-chip storage cost.

The GCN shader compiler emits scalar load instructions automatically. If it is known at compile time that a load address is wave-invariant (that is, the address is identical for all 64 threads in the wave), the compiler emits a scalar load, rather than having each wave independently load the same data. The most common sources for wave-invariant data are constant buffers and literal values. All integer math results based on wave-invariant data are also wave-invariant, as the scalar unit has a full integer instruction set. These scalar instructions are co-issued with vector SIMD instructions, and are generally free in terms of execution time.

The compute shader built-in input value, SV_GroupID , is also wave-invariant. This is important, as it allows you to offload group-specific data to scalar registers, reducing thread VGPR pressure.

Scalar load instructions do not support typed buffers or textures. If you want the compiler to load your data to SGPR instead of VGPR, you need to load data from a ByteAddressBuffer or StructuredBuffer . Do not use typed buffers and textures to store data that is common to the group. If you want to perform scalar loads from a 2D/3D data structure, you need custom address calculation math. Fortunately the address calculation math will also be co-issued efficiently as the scalar unit has a full integer instruction set.

Running out of SGPRs is also possible, but unlikely. The most common way to exceed your SGPR budget is by using an excessive number of textures and samplers. Texture descriptors consume eight SGPRs each, while samplers consume four SGPRs each. DirectX 11 allows using a single sampler with multiple textures. Usually, a single sampler is enough. Buffers descriptors only consume four SGPRs. Buffer and texture load instructions don’t need samplers, and should be used when filtering is not required.

Example: Each thread group transforms positions by a wave-invariant matrix, such as a view or projection matrix. You load the 4×4 matrix from Buffer<float4> using four typed load instructions. The data is stored to 16 VGPRs. That already wasted half of your VGPR budget! Instead, you should do four Load4 from a ByteAddressBuffer . The compiler will generate scalar loads, and store the matrix in SGPRs rather than VGPRs. Zero VGPRs wasted!

Unneeded Data

Homogeneous coordinates are commonly used in 3D graphics. In most cases, you know that W component is either 0 or 1. Do not load or use the W component in this case. It will simply waste one VGPR (per thread) and generate more ALU instructions.

Similarly, a full 4×4 matrix is only needed for projection. All affine transformations require at most a 4×3 matrix. Otherwise, the last column is (0, 0, 0, 1). A 4×3 matrix saves four VGPRs/SGPRs compared to a full 4×4 matrix.

Bit-packing

Bit-packing is a useful way to save memory. VGPRs are the most precious memory you have – they are very fast but also in very short supply. Fortunately, GCN provides fast, single-cycle bit-field extraction and insertion operations. With these operations, you can store multiple pieces of data efficiently inside a single 32-bit VGPR.

For example, 2D integer coordinates can be packed as 16b+16b. HLSL also has instructions to pack or extract two 16-bit floats to a 32-bit VGPR ( f16tof32 & f32tof16 ). These are full-rate on GCN.

If your data is already bit-packed in memory, load it directly to a uint register or LDS and don’t unpack it until use.

Booleans

The GCN compiler stores bool variables in a 64-bit SGPR, with one bit per lane in the wave. There is zero VGPR cost. Do not use int or float to emulate bools, or this optimization doesn’t work.

If you have more bools than can be accommodated in SGPRs, consider bit-packing 32 bools to a single VGPR. GCN has single-cycle bit-field extract/insert to manipulate bit fields quickly. In addition, you can use countbits() and firstbithigh() / firstbitlow() to do reductions and searching of bitfields. Binary prefix-sum can be implemented efficiently with countbits() , by masking previous bits and then counting.

Bools can also be stored in the sign bits of always-positive floats. abs() and saturate() are free functions on GCN – they are simple input/output modifiers that execute along with the operation using them —  so retrieving a bool stored in the sign bit is free. Do not use the HLSL sign() intrinsic to reclaim the sign. This produces suboptimal compiler output. It is always faster to test if a value is non-negative to determine the value of the sign bit.

Branches and Loops

Compilers try to maximize the code distance from data load to use, so that memory latency can be hidden by the instructions in between them. Unfortunately, data must be kept in VGPRs between the load and the use.

Dynamic loops can be used to reduce the VGPR life time. Load instructions that depend on the loop counter cannot be moved outside of the loop. VGPR life time is confined inside the loop body.

Use the [loop] attribute in your HLSL to force actual loops. Unfortunately, the [loop] attribute isn’t completely foolproof. The shader compiler can still unroll the loop if the number of required iterations is known at compile time.

16 bit registers

GCN3 introduced 16 bit register support. Vega extends this by performing 16 bit math at double rate. Both integers and floating point numbers are supported. Two 16 bit registers will be packed into a single VGPR. This is an easy way to save VGPR space when you don’t need full 32 bit of precision. 16 bit integers are perfect for 2D/3D address calculation (resource loads/stores and LDS arrays). 16 bit floats are useful in post processing filters among other things, especially when you are dealing with LDR or post tonemapped data.

LDS

When multiple threads in the same group are loading the same data, you should consider loading that data to LDS instead. This can bring big savings in both load instruction count and the number of VGPRs.

LDS can also be used to temporarily store registers when they are not needed right now. For example: A shader loads and uses a piece of data in the beginning and uses that data again in the end. However the VGPR peak occurs in the middle of the shader. You can store this data temporarily to LDS and load it back when you need it. This reduces VGPR usage during the peak, when it matters.

Conclusion

That’s it for today’s guest post – thanks a lot for reading and thanks a lot to Sebastian for writing it! If you have questions, feel free to comment or get in touch with him on Twitter directly by following @SebAaltonen, and remember to check out Claybook!

The post Optimizing GPU occupancy and resource usage with large thread groups appeared first on GPUOpen.

Radeon GPU Profiler 1.0

$
0
0

Introduction and thanks

Effective GPU performance analysis is a more complex proposition for developers today than it ever has been, especially given developments in how you drive the GPU in the last few years. The advent of hardware that can now overlap different workloads concurrently, and the birth and growth of new APIs to drive that kind of processing on the GPU, means that understanding what the GPU is doing in any given time period is very complex and difficult to understand. You need the right way to visualise what’s happening.

That’s the driving force behind our brand new cross-platform performance analysis tool: Radeon GPU Profiler (RGP). We created it to give developers a way to understand concurrent overlapped execution on Radeon GPUs in a way that’s simple and actionable in terms of further optimisation and what you need to do next.

We’ve worked closely with a wide range of internal development teams on a wide range of GPU development problems here at RTG, to make sure that RGP helps them understand how to optimise the performance of their game, app or whatever they’re working on.

We’ve also worked closely with a few key folks outside of AMD, letting them run RGP on their in-development games while RGP was in beta in order to help polish it for 1.0. Their feedback from that has been invaluable and we’d like to thank them publicly for their help and support in the run up to release.

Certain positive changes to RGP were made during beta based on common feedback from those partners, and RGP is a much better 1.0 than it could have been otherwise. Thank you to those folks, you know who you are!

Explicit APIs as our focus

The transition to modern explicit APIs such as DirectX® 12 and Vulkan® has required developers to learn about many lower level hardware constructs, such as barriers and hardware contexts, that were previously managed entirely by the driver. So we designed RGP specifically to help developers reason about some of the new software/hardware interactions no longer hidden by the API and driver.

Those two client APIs are built on top of a common lower-level internal API we call the Platform Abstraction Layer (PAL), and certain data that RGP needs for its functionality is surfaced by PAL. By focusing on those modern APIs we were able to tailor RGP to suit them best.

As you use RGP on Windows® or Linux™, you’ll come to appreciate that decision. For example, certain hardware constructs modeled by the new APIs are first class citizens in terms of the information we display, and how we help you visualise it. We couldn’t have built that functionality in for older APIs.

Using RGP internally

The development timelines of our first Vega GPU and RGP have fortuitously overlapped enough that we’ve been able to use the latter to do performance analysis work on the former, helping to assist Vega’s bring-up process. Bring-up for a GPU is effectively making sure that the entire software stack works, from the firmware all the way up to the usermode driver an app or game talks to, with the hardware revision we taped out.

Those interfaces between hardware and software can and do change between GPU families, and even between revisions of GPUs in the same overall family, as we learn lessons about performance and efficiency and tune things as time goes by.

As you can imagine, that process takes quite a long time. That’s because there’s a lot that the lower levels of the stack can do in that interface we have with the hardware, to set things up on the GPU that affect how it works. Making sure all of those things are optimal delivers the guts of a GPU’s performance in games.

One of the best ways to do that work is with something like RGP, because it lets you visualise how the GPU is actually executing. Being able to see command submissions turn into actual work dispatches on the GPU is invaluable, especially in cases where the game or app makes heavy use of asynchronous compute. Being able to see where things are executing concurrently right there on RGP’s timeline gives you an at-a-glance view of how the GPU is being scheduled.

So while using RGP on Vega one day during bring-up, one of our engineers was able to visualise on the timeline that asynchronous compute dispatches were being scheduled in a particular way, and that if we were able to ask the engines on the GPU that dispatch work to the CUs to schedule things slightly differently, we’d be able to extract some more performance for those async compute dispatches.

After some research and discussion with the hardware and driver teams, we determined that the other way to schedule the dispatches was optimal, the hardware could do it, and that we could enable it globally in the driver for all workloads. The net result? An increase in performance of 1-3% in a bunch of games and no regression in anything else.

Would we have fixed that without RGP? Probably, but it would have taken a lot longer to spot! The powerful way you can visualise how the GPU is working in RGP lets you pick up on things like that just by looking, giving you something actionable to go and investigate immediately.

So using our own software has helped us improve across the board performance on Vega ahead of launch in a nice measurable way. Game developers using RGP during its beta phase have already reaped rewards in their games due to the powerful visualisation of execution that it brings.

Just one of many tools in your toolbox

It’s worth talking about what RGP isn’t for a second, too. RGP is not a one-stop shop for all of your performance and debugging needs. It’s specifically not designed to be a debugger in fact! Instead, RGP is a complimentary tool to the other great tools available today. We’d like to call out RenderDoc here in particular.

The combination of RenderDoc and RGP together create a debugging and performance analysis toolchain that’s very powerful, and we’ve been happy to work with Baldur Karlsson to make sure that RenderDoc and RGP work well together and will be even better together in the future.

So whether you’re using PIX, GPUView, RenderDoc, or any of the other tools available today for this kind of work, including those from other vendors, we want RGP to be complimentary and find a home in your particular workflow.

The future of RGP

It’s worth repeating one of the reasons we wanted to build RGP: because of the way GPUs are driven now, spotting performance inefficiencies and optimisation opportunity is only possible if you’re presented with the data in an understandable and actionable manner. You need to know what to do next when presented with a view of your game or application’s performance.

That means we’ve rejected as much as we’ve accepted into RGP as time has gone by. RGP needs to help you move forwards and solve the performance puzzle, not overload you with data and be difficult to use effectively as a result, and we’ll continue to build it based on that ethos.

So what’s next for RGP? Firstly, we’d love you to use it and give us feedback, so that we can collect the common stuff and work on that as our top priority. That will help us polish the 1.0 experience to make sure it’s working well for most of you in your common analysis workflows.

When that’s done, we’ll start to work on a future roadmap and talk more about that here on GPUOpen. Great feedback is what will help us develop that and talk about it, so please use it in anger and then get involved and let us know what you think.

In the meantime, give it a try and come back to GPUOpen from time to time to learn more about it. We’ll have videos showing you to how to use it and unlock its potential, case studies on how it helped to solve real performance problems in games, and information on what’s coming next.

More information

You can find out more about RGP, including links to download this first release, on our product page.

Rys Sommefeldt looks after the Game Engineering group in Europe, which is part of the Radeon Technologies Group at AMD. Links to third party sites are provided for convenience and unless explicitly stated, AMD is not responsible for the contents of such linked sites and no endorsement is implied.

The post Radeon GPU Profiler 1.0 appeared first on GPUOpen.

Radeon GPU Profiler 1.0.2

$
0
0

Thanks (again!)

Before we dive into a run over the release notes for the 1.0.2 release of Radeon GPU Profiler, we’d like to thank everyone that’s tried it out so far and especially those of you that have given us great feedback. That feedback helps shape where we take development and what we focus on. So if there’s anything about it that you love, like, need us to fix, or would like to see, please just get in touch.

Radeon GPU Profiler 1.0.2

We released 1.0.2 yesterday primarily to add Radeon RX Vega support and fix bugs, but we also took the time since 1.0.1 to add a new feature!

We’ve made it easier to navigate between the different sections, so there’s now a back/forward button pair in the top left of the UI that helps you get back to where you were and flip between different sections, with associated keyboard controls (Alt + Left and Right arrow!). Check the Global Navigation section in the Keyboard Shortcuts area of Settings to find the full list of keyboard controls.

Notable fixed bugs include correct memory sizes for the GPU inside the Device configuration section, treatment of user markers as discrete points in time without associating them with the next event, and a fix for the ruler disappearing when zoomed in on a HiDPI display.

Radeon Developer Panel

For the Radeon Developer Panel which helps configure the driver for use with RGP, you now have proper Ctrl+C support for clean closing and better hotkey support, both on Linux. We also fixed support for peak clock profiling on certain GPUs.

More information

You can find out more about RGP, including links to the release binaries on GitHub, on our product page.

Rys Sommefeldt looks after the Game Engineering group in Europe, which is part of the Radeon Technologies Group at AMD. Links to third party sites are provided for convenience and unless explicitly stated, AMD is not responsible for the contents of such linked sites and no endorsement is implied.

The post Radeon GPU Profiler 1.0.2 appeared first on GPUOpen.


Stable barycentric coordinates

$
0
0

Intro

This week we have Alberto Taiuti as a guest poster. Alberto is now an engineer at Codeplay and we were lucky enough to work with him during his studies. Thanks, Alberto!

The AMD GCN Vulkan extensions allow developers to get access to some additional functionality offered by the GCN architecture which are not currently exposed in the VulkanTM API. One of these is the ability to access the barycentric coordinates at the fragment-shader level.

The problem

When using AMD’s VK_AMD_shader_explict_vertex_parameter extension (which itself exposes the SPV_AMD_shader_explict_vertex_parameter extension in SPIR-V) to read the hardware-calculated barycentric coordinates, you need a workaround to output the coordinates from the fragment shader in the expected order.

Without the workaround, the current implementation will select the provoking vertex for the primitive based on its screen orientation. However, if you need to rely on the logical position of the barycentric coordinates, i.e. the barycentric coordinate zero at the first vertex of the primitive, then a workaround is needed.

In order to better understand the problem, let’s visualise what happens when you output the barycentric coordinates directly from the fragment shader. In this example and the following one the mesh used is composed of two triangles forming a quad. This quad is rendered at different positions and multiple times using a call to vkCmdDrawIndexed and rotated by using 6 different model matrices indexed via gl_InstanceIndex in the vertex shader. The following image show how the primitives are arranged and the winding and rotation direction:

The vertex shader looks like this:

#version 450
#extension GL_ARB_separate_shader_objects : enable
#extension GL_ARB_shading_language_420pack : enable
#extension GL_ARB_shader_draw_parameters : enable #define kProjViewMatricesBindingPos 0
#define kModelMatricesBindingPos 0 layout (location = 0) in vec3 pos; layout (std430, set = 0, binding = kProjViewMatricesBindingPos) buffer MainStaticBuffer {
mat4 proj;
mat4 view;
}; layout (std430, set = 1, binding = kModelMatricesBindingPos) buffer ModelMats {
mat4 model_mats[];
}; void main() {
gl_Position = proj * view * model_mats[gl_InstanceIndex] * vec4(pos, 1.f);
}

Whereas the fragment shader looks like this:

#version 450
#extension GL_ARB_separate_shader_objects : enable
#extension GL_ARB_shading_language_420pack : enable
#extension GL_AMD_shader_explicit_vertex_parameter : enable layout (location = 0) out vec4 debug_out; void main() {
debug_out.xy = gl_BaryCoordSmoothAMD.xy;
debug_out.z = 1 – debug_out.x – debug_out.y;
}

Note the usage of #extension GL_AMD_shader_explicit_vertex_parameter : enable to enable the correct extension for the barycentric coordinates. That allows us to read the barycentric coordinates via gl_BaryCoordSmoothAMD.xy . In this example we read the barycentric coordinates with perspective interpolation at the fragment’s position.

The image produced is the following:

If the camera is rotated, the barycentric coordinates shift position due to the choosing of another provoking vertex by the implementation. Here, the camera is rotated just a bit in both directions as you can see on the top edge of the top-left box. Even this small rotation is enough to significantly change the output:

The solution

The fix consists of modifying both the vertex shader and the fragment shader as follows. Vertex shader first:

#version 450
#extension GL_ARB_separate_shader_objects : enable
#extension GL_ARB_shading_language_420pack : enable
#extension GL_ARB_shader_draw_parameters : enable #define kProjViewMatricesBindingPos 0
#define kModelMatricesBindingPos 0 layout (location = 0) in vec3 pos; layout (location = 0) flat out vec4 pos0;
layout (location = 1) out vec4 pos1; layout (std430, set = 0, binding = kProjViewMatricesBindingPos) buffer MainStaticBuffer {
mat4 proj;
mat4 view;
}; layout (std430, set = 1, binding = kModelMatricesBindingPos) buffer ModelMats {
mat4 model_mats[];
}; void main() {
vec4 temp = proj * view * model_mats[gl_InstanceIndex] * vec4(pos, 1.f);
pos0 = temp;
pos1 = temp;
gl_Position = temp;
}

And then the fragment shader:

#version 450
#extension GL_ARB_separate_shader_objects : enable
#extension GL_ARB_shading_language_420pack : enable
#extension GL_AMD_shader_explicit_vertex_parameter : enable layout (location = 0) flat in vec4 pos0;
layout (location = 1) __explicitInterpAMD in vec4 pos1; layout (location = 0) out vec4 debug_out; void main() {
vec4 v0 = interpolateAtVertexAMD(pos1, 0);
vec4 v1 = interpolateAtVertexAMD(pos1, 1);
vec4 v2 = interpolateAtVertexAMD(pos1, 2); if (v0 == pos0) {
debug_out.y = gl_BaryCoordSmoothAMD.x;
debug_out.z = gl_BaryCoordSmoothAMD.y;
debug_out.x = 1 – debug_out.z – debug_out.y;
}
else if (v1 == pos0) {
debug_out.x = gl_BaryCoordSmoothAMD.x;
debug_out.y = gl_BaryCoordSmoothAMD.y;
debug_out.z = 1 – debug_out.x – debug_out.y;
}
else if (v2 == pos0) {
debug_out.z = gl_BaryCoordSmoothAMD.x;
debug_out.x = gl_BaryCoordSmoothAMD.y;
debug_out.y = 1 – debug_out.x – debug_out.z;
}
}

We modified the shaders so that we can check the provoking vertex and modify the output accordingly. You can see that in the vertex shader we output two additional vec4 values:

layout (location = 0) flat out vec4 pos0;
layout (location = 1) out vec4 pos1;

pos0 is the non-interpolated vertex position which corresponds with the position of the provoking vertex by use of the flat directive. pos1 instead will use custom interpolation allowed by the GCN extensions. We can set custom interpolation to be used by adding the directive __explicitInterpAMD to an input variable in the fragment shader:

layout (location = 1) __explicitInterpAMD in vec4 pos1;

We can then retrieve its raw value without interpolation (as it was in the vertex shader) by using interpolateAtVertexAMD() in the fragment shader:

vec4 v0 = interpolateAtVertexAMD(pos1, 0);
vec4 v1 = interpolateAtVertexAMD(pos1, 1);
vec4 v2 = interpolateAtVertexAMD(pos1, 2);

This gives us the value of the three vertices forming the primitive in homogeneous coordinates and we can then use them to compare them with the value in homogeneous coordinates of the provoking vertex, hence achieving our end goal of finding the provoking vertex and allowing our workaround.

With the fix, the final render looks like this:

The location of the barycentric coordinates is now reliable and stable and can be used as a building block for more sophisticated rendering techniques and algorithms.

Rys Sommefeldt looks after the Game Engineering group in Europe, which is part of the Radeon Technologies Group at AMD. Links to third party sites are provided for convenience and unless explicitly stated, AMD is not responsible for the contents of such linked sites and no endorsement is implied.

The post Stable barycentric coordinates appeared first on GPUOpen.

AMD GPU Services 5.1.1

$
0
0

The AMD GPU Services (AGS) library provides game and application developers with the ability to query information about installed AMD GPUs and their driver, in order to access useful information that isn’t normally available through standard operating system or graphics APIs. AGS is also the gateway to some of the very useful extra functionality provided by AMD GPUs, especially for games and apps running on Windows®.

We recently released AGS 5.1.1, a significant update to the library with a whole bunch of great new features worth talking about. For starters, we now support Visual Studio 2017 in both the trio of samples that show you how to use AGS in practice, and in the pre-built static libraries that we provide for you to link into your app or game.

The static libraries are built for a number of different compiler and CRT configurations on 64-bit Windows platforms now, and also we’re working on signing them so that they’re easier to integrate into a fully-signed game or application project. Let us know if there’s another toolchain variant that you’d like to see.

AGS 5.1 is also the first version to support upcoming FreeSync™ 2 displays, allowing your application to drive them more efficiently. FreeSync 2 moves the tone-mapping part of the HDR presentation to the GPU. It previously would have been handled by the display, potentially increasing latency, and so moving it to the GPU is a key benefit of FreeSync 2 for your games. AGS 5.1 gives you the control you need to implement that.

There’s also support for a couple of new wave-level intrinsic operations on supporting GCN and Vega GPUs — wave scan and wave reduce — on both DirectX® 11 and DirectX 12, as a building block for algorithms that need cross-lane work. We also have support for user debug markers with DirectX 12, something that’s very useful when trying to understand what’s going on with Radeon GPU Profiler!

Lastly, as far as notable new features go at least, we’ve added support for our app registration extension for DirectX 11. If your game is built with a popular in-house or public engine middleware like Unity, Unreal Engine 4 or Frostbite™, using the app registration extension to tell the driver a bit more about your application potentially helps the driver do a better job with the performance or compatibility of your game.

Download and Documentation

You can download the latest 5.1.1 release on GitHub and check out the product page on GPUOpen. The documentation was also updated to reflect the 5.1.1 release changes.

Rys Sommefeldt looks after the Game Engineering group in Europe, which is part of the Radeon Technologies Group at AMD. Links to third party sites are provided for convenience and unless explicitly stated, AMD is not responsible for the contents of such linked sites and no endorsement is implied.

The post AMD GPU Services 5.1.1 appeared first on GPUOpen.

Radeon GPU Profiler 1.0.3

$
0
0

Radeon GPU Profiler 1.0.3

A couple of months on from the release of 1.0.2, we’ve fully baked and sliced 1.0.3 for your low-level DX12- and Vulkan-based performance analysis needs. With some of the functionality that RGP is built on being provided by our driver stack, there are a few things that we’d hoped to get into this release that didn’t quite make it due to an accelerated driver release schedule, but there’s still plenty to talk about for both RGP and the developer panel that provides some of the profiling and settings control.

Radeon GPU Profiler

Radeon GPU Profiler first, there’s now access to system information in the UI on Windows (we’re working on Linux support for that but it’s trickier to get right), you can now see GPU time duration information in user marker regions and groups in the Event timing view, and there’s better sync between some event status information in the Event timing and wavefront occupancy views.

When it comes to usability enhancements, you can now load a profile into RGP by just dragging it onto the RGP executable on Windows, or the open RGP UI on any platform. We also now bring the selected event into the view when using Shift+Left or Shift+Right to jump between them in the wavefront occupancy view. Lastly in the list of nice usability changes worth highlighting, CTRL+T now cycles between time units in any view, so you don’t have to dip into settings to adjust that.

Radeon Developer Panel

Thanks to everyone who asked for a headless version of the Radeon Developer Service. We heard you loud and clear, so now there’s RadeonDeveloperServiceCLI.exe on Windows, and RadeonDeveloperServiceCLI on Linux. We also show you the listening port number in the configuration window just in case you need to know what it is, and we have a fix for drawing the panel properly on lower resolution 720p displays.

More information

As always, you can find out more about RGP, including links to the release binaries on GitHub and the full release notes list, on our product page.

Rys Sommefeldt looks after the Game Engineering group in Europe, which is part of the Radeon Technologies Group at AMD. Links to third party sites are provided for convenience and unless explicitly stated, AMD is not responsible for the contents of such linked sites and no endorsement is implied.

The post Radeon GPU Profiler 1.0.3 appeared first on GPUOpen.

Radeon GPU Profiler 1.1.0

$
0
0

Radeon GPU Profiler 1.1.0

It feels like just last week that we released Radeon GPU Profiler (RGP) 1.0.3 but my calendar says almost 2 months have passed. For 1.0.3, we were on an accelerated schedule that saw us drop a few things from the release plan. There’s no such feature cutting in 1.1, which we’ve packed full of feedback-driven new stuff, tweaks and bug fixes. Let’s dive in to what’s new in RGP and the developer panel.

Radeon GPU Profiler

We’ve added a GPU-only view option to the system activity view that lets you visualise cross-queue synchronisation events more easily, and we’ve also made it possible to colour by command buffer in the Event Timing and wavefront occupancy timeline views. That makes it simple to see groups of draws from the same command buffer.

We now also show you whether a barrier came from your application or the driver. Sometimes the driver needs to insert a barrier to ensure correctness and adherence to strict API specifications, so now RGP will help you see when that happened. That lets you correlate your own barrier events a lot better, and see what’s going on around the driver’s own barrier issue. In a future release of RGP we’ll also tell you why they happened!

For certain kinds of draws, we can now also show you some of the fixed-function part of the workload within a draw event, in the Event Timing and wavefront occupancy views. In particular, for depth-only draws you get to see when certain hardware blocks are active, helping to explain gaps in the timeline for draws that exercise the fixed blocks in a measurable way.

Lastly in the list of big things to highlight, we now show you which render states caused a context roll. We’ll be writing about context rolls on GPUOpen soon to give you even more information about what RGP is able to show you, and give you more insight about how the hardware works.

For the full list, make sure to check out the complete release notes which are linked below.

Radeon Developer Panel

The Radeon Developer Panel (RDP), which you use to configure the settings and features of the driver when it’s in developer mode as RGP talks to it, also got some significant updates.

Maximum clocks are now reported properly on the clocks tab when the developer driver is being run on a Linux system, and there’s now a close button on the Radeon Developer Service (RDS) configuration panel to let you easily close it and drag it around.

In addition, you can reset the Radeon RDS port number with a single click, and RDP now tells you if the paths you’ve set for RGP or captured profiles are somehow invalid.

More information

As always, you can find out more about RGP, including links to the release binaries on GitHub and the full release notes list, on our product page. Please check this first release of RGP 1.1 out!

Rys Sommefeldt looks after the Game Engineering group in Europe, which is part of the Radeon Technologies Group at AMD. Links to third party sites are provided for convenience and unless explicitly stated, AMD is not responsible for the contents of such linked sites and no endorsement is implied.

The post Radeon GPU Profiler 1.1.0 appeared first on GPUOpen.

Radeon GPU Profiler 1.1.1

$
0
0

Radeon GPU Profiler 1.1.1

With GDC 2018 getting ever closer, we wanted to get one last minor release of RGP out before things get hectic into the run up to the conference. It’s mostly polish and bug fixes compared to 1.1.0, with no new major features. We hope that’s very welcome when it comes to software we want you to be able to rely on day-to-day. Let’s check out the release highlights to see what’s new.

Radeon GPU Profiler

Firstly, we’ve changed the units on the ruler in the Event view and frame summary to be multiples of 10, to make it much easier to understand what you’re looking at. We’ve also fixed a bug where duplicate events should show up in small profiles when you looked at the view of the most expensive events. Sorry about that.

In the barrier view, we now show you all events sequentially if multiple command queues are used, and we now correctly show the contribution of fixed-function clipping in the event timeline view when looking at wavefront occupancy.

Lastly for the notable fixes, we now surface how much LDS memory is used by the compute shader used in the CS pipe, to make it easier to understand what’s happening in your compute programs.

There are a number of other smaller fixes in there too, so be sure and hop over to the releases page on GitHub where there’s a more complete list.

Radeon Developer Panel

Not much has changed in the panel, although we did fix a bug where the panel would sometimes hang on exit under certain conditions. Even though we didn’t do too much with the panel, a small amount of love is love nonetheless ❤️

More information

As always, you can find out more about RGP, including links to the release binaries on GitHub and the full release notes list, on our product page. As always: please send us any and all feedback so that we can keep making RGP the best developer-focused performance analysis tool for modern graphics work.

Rys Sommefeldt looks after the Game Engineering group in Europe, which is part of the Radeon Technologies Group at AMD. Links to third party sites are provided for convenience and unless explicitly stated, AMD is not responsible for the contents of such linked sites and no endorsement is implied.

The post Radeon GPU Profiler 1.1.1 appeared first on GPUOpen.

Viewing all 32 articles
Browse latest View live